

Improving embryonic stem cell expansion through the combination of perfusion and Bioprocess model design
- PMID: 24339957
- PMCID: PMC3858261
- DOI: 10.1371/journal.pone.0081728
Improving embryonic stem cell expansion through the combination of perfusion and Bioprocess model design
Abstract
Background: High proliferative and differentiation capacity renders embryonic stem cells (ESCs) a promising cell source for tissue engineering and cell-based therapies. Harnessing their potential, however, requires well-designed, efficient and reproducible expansion and differentiation protocols as well as avoiding hazardous by-products, such as teratoma formation. Traditional, standard culture methodologies are fragmented and limited in their fed-batch feeding strategies that afford a sub-optimal environment for cellular metabolism. Herein, we investigate the impact of metabolic stress as a result of inefficient feeding utilizing a novel perfusion bioreactor and a mathematical model to achieve bioprocess improvement.
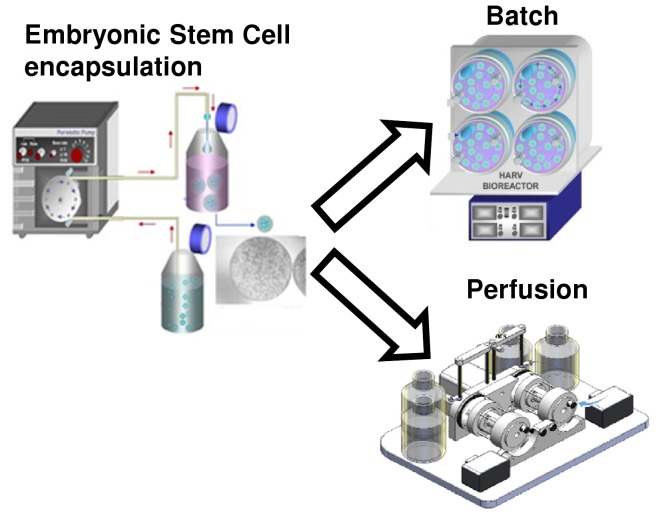
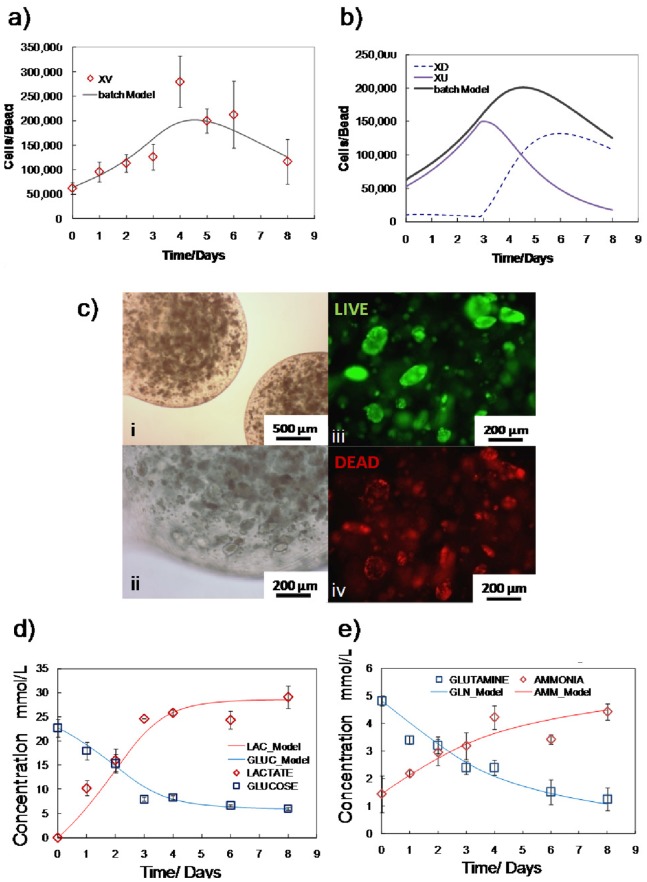
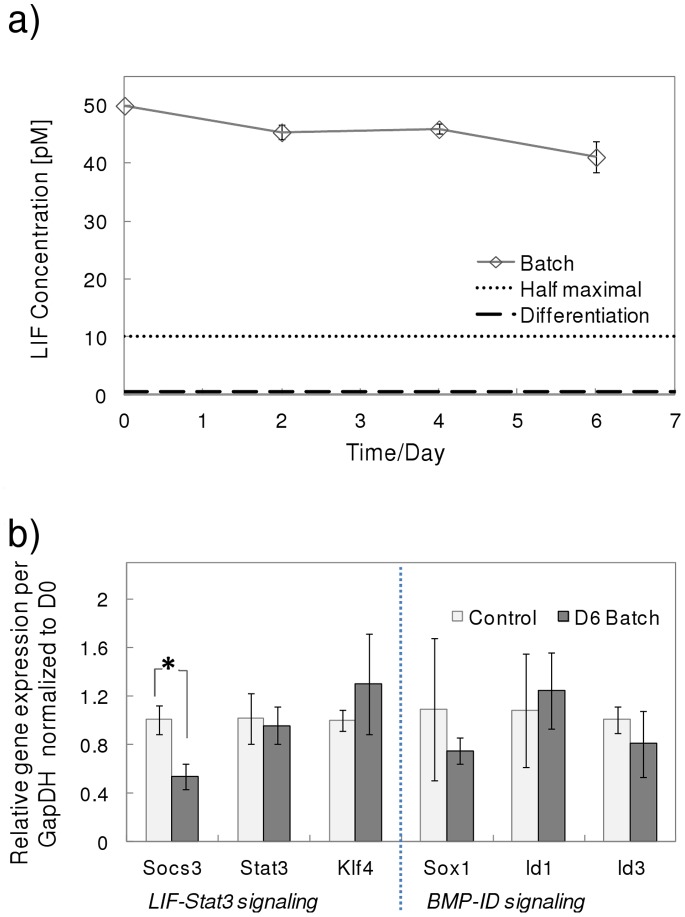
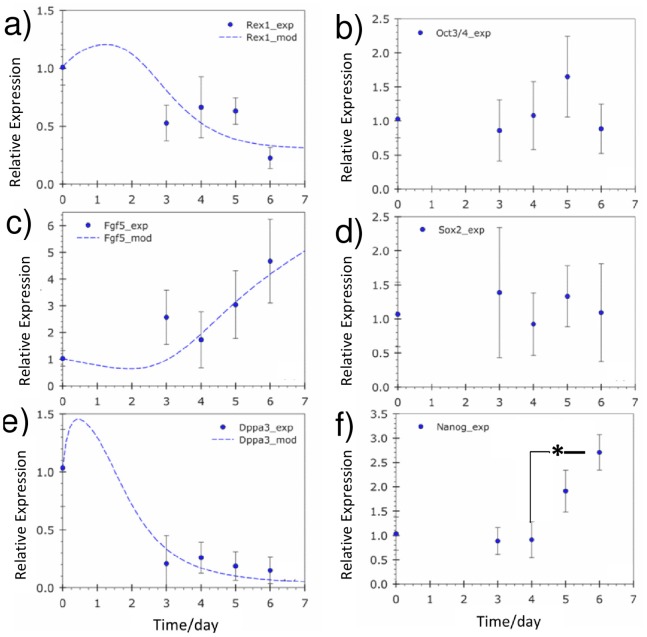
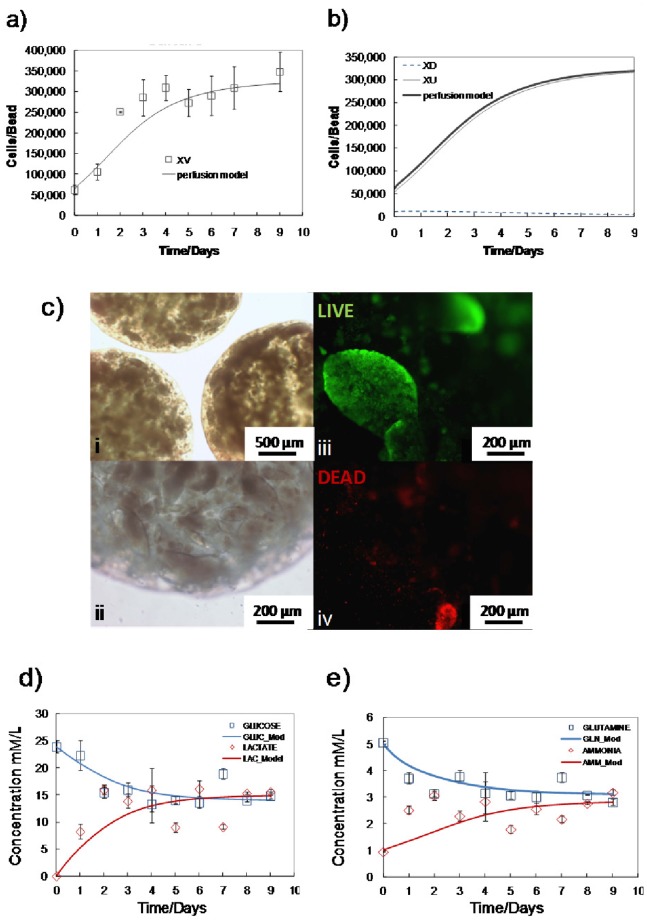
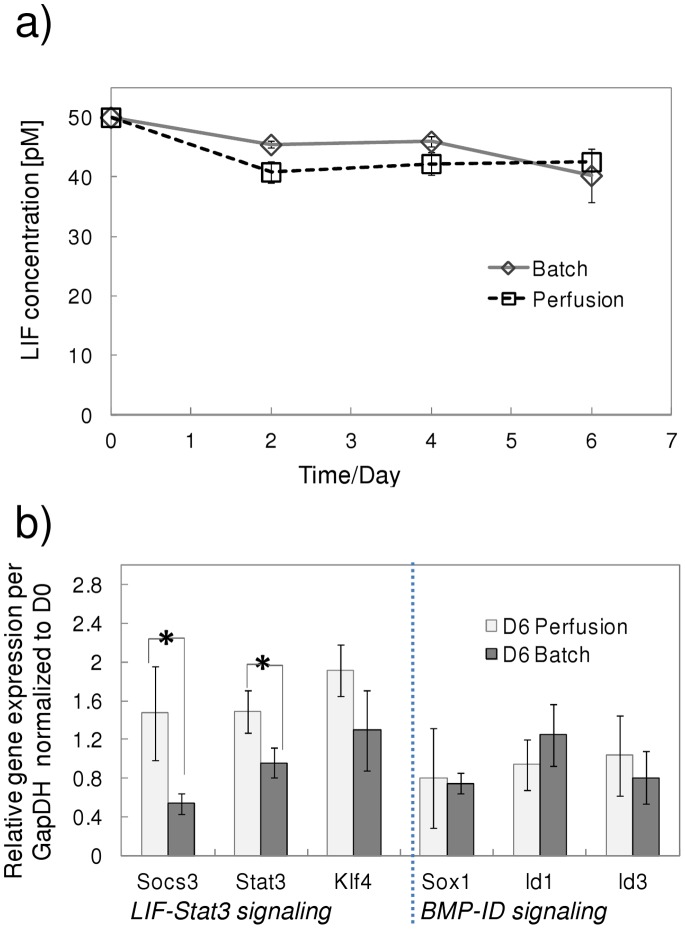
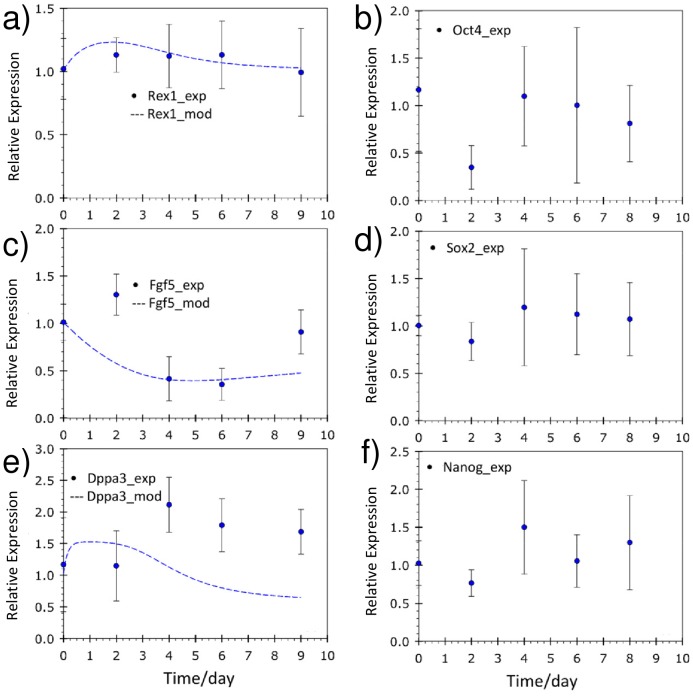
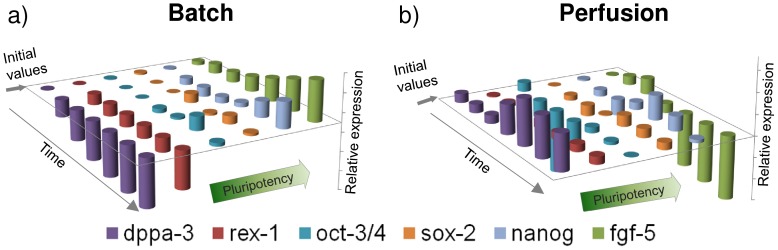
Methodology/principal findings: To characterize nutritional requirements, the expansion of undifferentiated murine ESCs (mESCs) encapsulated in hydrogels was performed in batch and perfusion cultures using bioreactors. Despite sufficient nutrient and growth factor provision, the accumulation of inhibitory metabolites resulted in the unscheduled differentiation of mESCs and a decline in their cell numbers in the batch cultures. In contrast, perfusion cultures maintained metabolite concentration below toxic levels, resulting in the robust expansion (>16-fold) of high quality 'naïve' mESCs within 4 days. A multi-scale mathematical model describing population segregated growth kinetics, metabolism and the expression of selected pluripotency ('stemness') genes was implemented to maximize information from available experimental data. A global sensitivity analysis (GSA) was employed that identified significant (6/29) model parameters and enabled model validation. Predicting the preferential propagation of undifferentiated ESCs in perfusion culture conditions demonstrates synchrony between theory and experiment.
Conclusions/significance: The limitations of batch culture highlight the importance of cellular metabolism in maintaining pluripotency, which necessitates the design of suitable ESC bioprocesses. We propose a novel investigational framework that integrates a novel perfusion culture platform (controlled metabolic conditions) with mathematical modeling (information maximization) to enhance ESC bioprocess productivity and facilitate bioprocess optimization.
Conflict of interest statement
Figures
Similar articles
-
Embryonic stem cells remain highly pluripotent following long term expansion as aggregates in suspension bioreactors.J Biotechnol. 2007 May 1;129(3):421-32. doi: 10.1016/j.jbiotec.2007.01.006. Epub 2007 Jan 21. J Biotechnol. 2007. PMID: 17306403
-
Expansion of undifferentiated murine embryonic stem cells as aggregates in suspension culture bioreactors.Tissue Eng. 2006 Nov;12(11):3233-45. doi: 10.1089/ten.2006.12.3233. Tissue Eng. 2006. PMID: 17518637
-
Shear stress influences the pluripotency of murine embryonic stem cells in stirred suspension bioreactors.J Tissue Eng Regen Med. 2014 Apr;8(4):268-78. doi: 10.1002/term.1518. Epub 2012 Jun 1. J Tissue Eng Regen Med. 2014. PMID: 22653738
-
A two-stage perfusion fibrous bed bioreactor system for mass production of embryonic stem cells.Expert Opin Biol Ther. 2008 Jul;8(7):895-909. doi: 10.1517/14712598.8.7.895. Expert Opin Biol Ther. 2008. PMID: 18549321 Review.
-
Current state and perspectives in modeling and control of human pluripotent stem cell expansion processes in stirred-tank bioreactors.Biotechnol Prog. 2017 Mar;33(2):355-364. doi: 10.1002/btpr.2431. Epub 2017 Jan 10. Biotechnol Prog. 2017. PMID: 28019701 Review.
Cited by
-
Three-Dimensional Human Bone Marrow Organoids for the Study and Application of Normal and Abnormal Hematoimmunopoiesis.J Immunol. 2023 Apr 1;210(7):895-904. doi: 10.4049/jimmunol.2200836. J Immunol. 2023. PMID: 36947817 Free PMC article. Review.
-
Links between DNA Replication, Stem Cells and Cancer.Genes (Basel). 2017 Jan 25;8(2):45. doi: 10.3390/genes8020045. Genes (Basel). 2017. PMID: 28125050 Free PMC article. Review.
-
A distribution-based approach for determining lot sizes in the filling of human-induced pluripotent stem cells.Regen Ther. 2019 May 17;12:94-101. doi: 10.1016/j.reth.2019.04.012. eCollection 2019 Dec 15. Regen Ther. 2019. PMID: 31890772 Free PMC article.
-
Kinetic modeling of human induced pluripotent stem cell expansion in suspension culture.Regen Ther. 2019 Apr 25;12:88-93. doi: 10.1016/j.reth.2019.04.007. eCollection 2019 Dec 15. Regen Ther. 2019. PMID: 31890771 Free PMC article.
-
Higher-Density Culture in Human Embryonic Stem Cells Results in DNA Damage and Genome Instability.Stem Cell Reports. 2016 Mar 8;6(3):330-41. doi: 10.1016/j.stemcr.2016.01.015. Epub 2016 Feb 25. Stem Cell Reports. 2016. PMID: 26923824 Free PMC article.
References
-
- Thomson H (2007) Bioprocessing of embryonic stem cells for drug discovery. Trends in Biotechnology 25: 224–230. - PubMed
-
- Leung HW, Chen A, Choo AB, Reuveny S, Oh SK (2011) Agitation can induce differentiation of human pluripotent stem cells in microcarrier cultures. Tissue Eng Part C Methods 17: 165–172. - PubMed
-
- Toyooka Y, Shimosato D, Murakami K, Takahashi K, Niwa H (2008) Identification and characterization of subpopulations in undifferentiated ES cell culture. Development 135: 909–918. - PubMed
Publication types
MeSH terms
LinkOut - more resources
Full Text Sources
Other Literature Sources
