. 2013 Dec 5;8(12):e81870.
doi: 10.1371/journal.pone.0081870. eCollection 2013.

AMPK activation through mitochondrial regulation results in increased substrate oxidation and improved metabolic parameters in models of diabetes

Affiliations

AMPK activation through mitochondrial regulation results in increased substrate oxidation and improved metabolic parameters in models of diabetes

Yonchu Jenkins et al. PLoS One. .

Abstract

Modulation of mitochondrial function through inhibiting respiratory complex I activates a key sensor of cellular energy status, the 5'-AMP-activated protein kinase (AMPK). Activation of AMPK results in the mobilization of nutrient uptake and catabolism for mitochondrial ATP generation to restore energy homeostasis. How these nutrient pathways are affected in the presence of a potent modulator of mitochondrial function and the role of AMPK activation in these effects remain unclear. We have identified a molecule, named R419, that activates AMPK in vitro via complex I inhibition at much lower concentrations than metformin (IC50 100 nM vs 27 mM, respectively). R419 potently increased myocyte glucose uptake that was dependent on AMPK activation, while its ability to suppress hepatic glucose production in vitro was not. In addition, R419 treatment of mouse primary hepatocytes increased fatty acid oxidation and inhibited lipogenesis in an AMPK-dependent fashion. We have performed an extensive metabolic characterization of its effects in the db/db mouse diabetes model. In vivo metabolite profiling of R419-treated db/db mice showed a clear upregulation of fatty acid oxidation and catabolism of branched chain amino acids. Additionally, analyses performed using both (13)C-palmitate and (13)C-glucose tracers revealed that R419 induces complete oxidation of both glucose and palmitate to CO2 in skeletal muscle, liver, and adipose tissue, confirming that the compound increases mitochondrial function in vivo. Taken together, our results show that R419 is a potent inhibitor of complex I and modulates mitochondrial function in vitro and in diabetic animals in vivo. R419 may serve as a valuable molecular tool for investigating the impact of modulating mitochondrial function on nutrient metabolism in multiple tissues and on glucose and lipid homeostasis in diabetic animal models.


Conflict of interest statement

Competing Interests: YJ, TQS, VM, WL, HN, YL, AP, GU, LG, KB, SLY, TG, TK, AO, IJS, KM, KW, GG, RA, CC, HR, RB, DJS, XX, SDI, DCC, DAG, SJS, RS, DGP, TMK and YH are or have been employees of Rigel Pharmaceuticals, Inc. LGB is an employee of SiDMAP, LLC. The remaining authors declare no competing financial interests. This does not alter the authors' adherence to all the PLOS ONE policies on sharing data and materials.

Figures

Figure 1
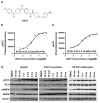
Figure 1. R419 structure and AMPK activation in HepG2 cells, C2C12 myotubes, and XA15A1 adipocytes.
A: Chemical structure of R419. B and C: Dose response relationship between R419 and AMPK activation in HepG2 cells and C2C12 myotubes. Mean ± SD of EC50 values acquired from multiple experiments (the number of experiments is indicated in parentheses) and representative EC50 curves are presented. D: AMPK activation by R419 in HepG2 cells, C2C12 myotubes, and XA15A1 adipocytes. The cells were incubated with 0.2 µM R419 at 37°C for 2 hours. Lysates were blotted using the indicated antibodies.
Figure 2
Figure 2. Reduction of mitochondrial respiration by R419 through complex I inhibition.
A: Increase in AMP/ATP and ADP/ATP ratios in HepG2 cells. The cells were treated with 0.05% DMSO (open bar) or 200 nM R419 (solid bar) for 6 hours. Nucleotide levels were measured by HPLC. The data are presented as mean (bar) ± SEM (line) of triplicate cultures. Unpaired two-tailed t-tests were performed between DMSO control and R419-treated group. Asterisks ** and *** represent p < 0.01 and p < 0.001. B: Dose-dependent reduction of oxygen consumption rate (OCR) in HepG2 cells. OCR in the presence of DMSO or R419 was measured using an XF24 Seahorse instrument. Time point of R419 or DMSO injection is indicated by arrow. The data are presented as mean (symbol) ± SEM (line) of triplicate cultures. Repeated measures two-way ANOVA followed by the Dunnett ad-hoc test was performed and the multiple comparisons were done against the corresponding DMSO control at each timepoint. Asterisks *, **, *** and # represent p < 0.05, p<0.01, p<0.001 and p < 0.0001. C: Intact succinate-driven respiration in the presence of R419 in purified mouse liver mitochondria. The assay was conducted using an XF24 Seahorse instrument according to manufacturer’s protocols. 5 µg of purified mitochondria per well were used. Rotenone (Ro), succinate (Suc), antimycin A (Ant) and ascorbate/N,N,N',N'-tetramethyl-p-phenylene diamine (As/T) mixture were introduced at timepoints indicated by arrows. DMSO (n=6) or R419 (n=4) was introduced immediately prior to the assay. The data are presented as mean (symbol) ± SEM (line). Repeated measures two-way ANOVA followed by the Sidak ad-hoc test was performed and the multiple comparison test was done against the corresponding DMSO control at each timepoint. Except for time 0, significant differences in OCR between the two groups were not observed. Asterisk * represents p < 0.01. D: Inhibition of complex I-mediated NADH oxidation by R419 in purified mouse liver mitochondria. R419 or metformin was added to a mitochondrial lysate preparation (330 µg/ml) containing 2 mM NADH and incubated for 20 minutes. NADH to NAD+ conversion was measured by monitoring the absorbance at 340 nm. Difference between the initial absorbance and the absorbance after 20-minute incubation was presented as ΔA340 a.u. (absorbance units). The data are presented as mean (symbol) ± range between two measures (line) of duplicate cultures. Statistical analyses were not performed for this Data Set. E: Reduction of NAD+/NADH ratio by R419. HepG2 cells were treated with 0.05% DMSO or R419 for 2 hours. NAD+ and NADH levels in cell lysates were measured using a commercially available kit. The data are presented as mean (bar) ± range between two measures (line) of duplicate cultures. Ordinary one-way ANOVA with the Dunnett ad-hoc test was performed. The multiple comparison test was done against the DMSO control. Asterisk ** represents p < 0.01.
Figure 3
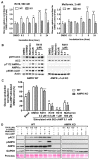
Figure 3. AMPK-dependent glucose uptake and AMPK-independent gluconeogenesis inhibition by R419.
A: AMPK-dependent glucose uptake by R419 in primary mouse muscle cells. The cells were exposed to R419 or metformin for indicated times. Glucose uptake was assayed by incorporation of 2-deoxy-D-[3H]glucose (1%Ci/ml, 26.2 Ci/mmol) into the cell lysate in 10 min. The data are presented as mean (bar) ± SEM (line) of 2~8 individual experiments performed in triplicate (line) (n=8 (DMSO), n=3 (0.5 hour), n=4 (1 hour), n=7 (2 hours), n=2 (6 hours) and n=3 (24 hours)). Ordinary two-way ANOVA followed by the Dunnett ad-hoc test was performed and the multiple comparison test within the same genotype was done against each DMSO control. Asterisks *, ** and *** represent p<0.05, p<0.01 and p < 0.001, respectively. B: AMPK-dependent ACC and ULK1 phosphorylation by R419. Primary muscle cells from AMPK wild type mice and AMPK α1/α2 KO mice were treated with A-769662 (300 µM), metformin (5 mM), AICAR (2 mM), and R419 (0.01, 0.1 and 1 µM) for one hour. Lysates were blotted using the indicated antibodies. C: AMPK-independent suppression of glucose production by R419. Primary hepatocytes from WT mice and AMPK α1/α2 KO mice were stimulated with Bt2-cAMP in the presence or absence of R419 or metformin for eight hours. The amount of glucose released into the media was normalized to protein content. Data are normalized to DMSO control and presented as mean (bar) ± SEM (line) of triplicate cultures. Ordinary two-way ANOVA followed by the Dunnett ad-hoc test was performed and the multiple comparisons within the same genotype was done against each DMSO control. Significance against each DMSO control is indicated on top of the bars. Asterisks *** and # represent p<0.001 and p < 0.0001, respectively. Genotype (WT vs KO) is not a significant source of variation by ordinary two-way ANOVA. D: AMPK-dependent ACC and AMPK phosphorylation in hepatocytes by R419. Primary hepatocytes from wild type mice (WT) and AMPK α1/α2 KO mice (AMPK KO) were stimulated with 100 µM Bt2-cAMP in the presence or absence of R419 (0.1, 0.2, 0.5 and 1 µM), A-769662 (30 µM) or metformin (0.5 mM) for eight hours. Lysates were blotted using the indicated antibodies. Quantities of transferred protein on the membrane were examined with Ponceau S staining solution (Ponceau). The images of western blots and the Ponceau S-stained membrane are trimmed and different parts of the same blots are grouped.
Figure 4
Figure 4. AMPK dependence of R419 mediated fatty acid oxidation and inhibition of fatty acid synthesis.
A: Primary hepatocytes from wild type mice (WT: open bar) and AMPK α1/α2 KO mice (AMPK KO: hatched bar) were cultured in the presence or absence of R419 (0.2, 0.5 and 1 µM), or TOFA (10 µM) for three hours. Exogenous palmitate oxidation was monitored by the production of 14C-labeled acid-soluble metabolites as described in materials and methods. The data are presented as mean (bar) ± SEM (line) of triplicate cultures. Ordinary two-way ANOVA followed by the Dunnett ad-hoc test was performed for statistical analyses and the multiple comparisons within the same genotype were performed against each DMSO control. Significance against each DMSO control is indicated on top of the bars. Asterisks ** and # represent p < 0.01 and p < 0.0001. B: Primary hepatocytes from wild type mice (WT: open bar) and AMPK α1/α2 KO mice (AMPK KO: hatched bar) were cultured in the presence or absence of R419 (0.2, 0.5 and 1 µM), or TOFA (10 µM) for three hours. Acetate incorporation was monitored by the production of 14C-labeled lipids as described in materials and methods. The data are presented as mean (bar) ± SEM (line) of triplicate cultures. Ordinary two-way ANOVA followed by the Dunnett ad-hoc test was performed for statistical analyses and the multiple comparisons within the same genotype were performed against each DMSO control. Significance against each DMSO control is indicated on top of the bars. Asterisks *** and # represent p < 0.001, and p < 0.0001.
Figure 5
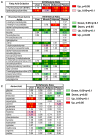
Figure 5. Effects on fatty acid, BCAA, and amino acid pathways in db/db mice treated with R419.
Male db/db mice (8 weeks old) were PO QD dosed with vehicle or 10 mg/kg R419. Thirty minutes after oral dosing, liver, muscle, and adipose tissues and plasma were collected at 3 days (n = 6) of compound administration and analyzed at Metabolon for metabolite profiles. A: Heat map of fatty acid oxidation metabolites in liver, muscle, adipose, and plasma from R419-treated mice shown relative to vehicle. B: Heat map of intermediates of branched chain amino acid catabolism in liver, muscle, adipose, and plasma from R419-treated mice shown relative to vehicle. C: Heat map of amino acids in liver, muscle, adipose, and plasma from R419-treated mice shown relative to vehicle. Biochemical data were analyzed using Welch’s two-sample t-tests.
Figure 6
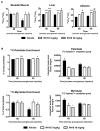
Figure 6. Increased palmitate oxidation in db/db mice treated with R419.
Male db/db mice (8 weeks old) were PO QD dosed with vehicle, 5 mg/kg R419, or 10 mg/kg R419 for 8 days. On day 8, mice were orally gavaged with 0.5 mg/kg [U-13C]-palmitate 30 minutes after compound dosing. Liver, skeletal muscle, and adipose samples were collected at 60 and 120 minutes following palmitate administration (n=4). Complete oxidation of [U-13C]-palmitate to 13CO2 is shown as 13CO2 enrichment (13CO2/12CO2 ratio) in skeletal muscle, liver, and adipose. The data are presented as mean (bar) ± SEM (line). Statistical analyses between an R419-treated group and the corresponding vehicle control were performed using the unpaired 2-tailed Student t test. Asterisks *, **, *** and # represent p < 0.05, p < 0.01, p <0.001, and p < 0.0001, respectively for R419 treatment compared to vehicle.
Figure 7
Figure 7. Effects on glucose metabolism in db/db mice treated with R419.
Male db/db mice (8 weeks old) were PO QD dosed with vehicle, 5 mg/kg R419, or 10 mg/kg R419 for 8 days. On day 8, mice were given an intraperitoneal injection of 0.5 mg/kg [U-13C]-D-glucose 30 minutes after compound dosing. Liver, skeletal muscle, adipose, and plasma samples were collected at 60 and 90 minutes following glucose injection (n=4). A: 13CO2 enrichment (13CO2/12CO2 ratio) in skeletal muscle, liver, and adipose. B: 13C-labeled palmitate or myristate enrichment (% of palmitate or myristate) and normalized palmitate or myristate measured following saponification of skeletal muscle acylglycerols and acylcarnitines. % of total fatty acid was obtained using the following formula, (integrated peak area of 13C-labeled fatty acid)/ (integrated peak area of 13C-labeled plus unlabeled fatty acid). Total fatty acid (labeled plus unlabeled) was normalized by tissue weight. The data are presented as mean (bar) ± SEM (line). Statistical analyses between an R419-treated group and the corresponding vehicle control were performed using the unpaired 2-tailed Student t test. Asterisks *, ***, #, and ## represent p < 0.05, p <0.001, p < 0.0001, and p < 0.00001 respectively for R419 treatment compared to vehicle.
Figure 8
Figure 8. Scheme illustrating possible metabolic route of 13C-glucose to 13CO2 occurring in skeletal muscle from R419-treated db/db mice.
Input glucose is broken down via glycolysis to pyruvate, which is decarboxylated to CO2 and acetyl CoA. 13C-acetyl CoA can be condensed with oxaloacetate to form citrate, used to elongate short-chain fatty acids or routed for BHBA production. Skeletal muscle mitochondrial short chain fatty acid elongation utilizes acetyl-CoA acyltransferase, 3-hydroxyacyl-CoA dehydrogenase, enoyl-CoA hydratase, enoyl-CoA reductase, and NADH as a reducing agent. Although in general, R419-treatment resulted in reduction of palmitate and myristate levels in the skeletal muscle, these fatty acid pools were enriched in 13C-labeled palmitate and myristate. 13C-palmitate and 13C-myristate can be broken down by β-oxidation, releasing 13C-acetyl CoA, which can enter the TCA cycle and be released as 13CO2 by either isocitrate dehydrogenase or α-ketoglutarate dehydrogenase after multiple cycles. Asterisks indicate a molecule is 13C-labeled. Dashed arrows indicate multistep conversions.

Similar articles

Cited by

References

    1. Lamson DW, Plaza SM (2002) Mitochondrial factors in the pathogenesis of diabetes: a hypothesis for treatment. Altern Med Rev 7: 94-111. PubMed: 11991790. - PubMed
    1. Sivitz WI, Yorek MA (2010) Mitochondrial dysfunction in diabetes: from molecular mechanisms to functional significance and therapeutic opportunities. Antioxid Redox Signal 12: 537-577. doi:10.1089/ars.2009.2531. PubMed: 19650713. - DOI - PMC - PubMed
    1. Pospisilik JA, Knauf C, Joza N, Benit P, Orthofer M et al. (2007) Targeted deletion of AIF decreases mitochondrial oxidative phosphorylation and protects from obesity and diabetes. Cell 131: 476-491. doi:10.1016/j.cell.2007.08.047. PubMed: 17981116. - DOI - PubMed
    1. Wredenberg A, Freyer C, Sandström ME, Katz A, Wibom R et al. (2006) Respiratory chain dysfunction in skeletal muscle does not cause insulin resistance. Biochem Biophys Res Commun 350: 202-207. doi:10.1016/j.bbrc.2006.09.029. PubMed: 16996481. - DOI - PubMed
    1. Vernochet C, Mourier A, Bezy O, Macotela Y, Boucher J et al. (2012) Adipose-specific deletion of TFAM increases mitochondrial oxidation and protects mice against obesity and insulin resistance. Cell Metab 16: 765-776. doi:10.1016/j.cmet.2012.10.016. PubMed: 23168219. - DOI - PMC - PubMed

Publication types

MeSH terms