. 2013 Dec 10;8(12):e81984.
doi: 10.1371/journal.pone.0081984. eCollection 2013.

To control false positives in gene-gene interaction analysis: two novel conditional entropy-based approaches

Affiliations

To control false positives in gene-gene interaction analysis: two novel conditional entropy-based approaches

Xiaoyu Zuo et al. PLoS One. .

Abstract

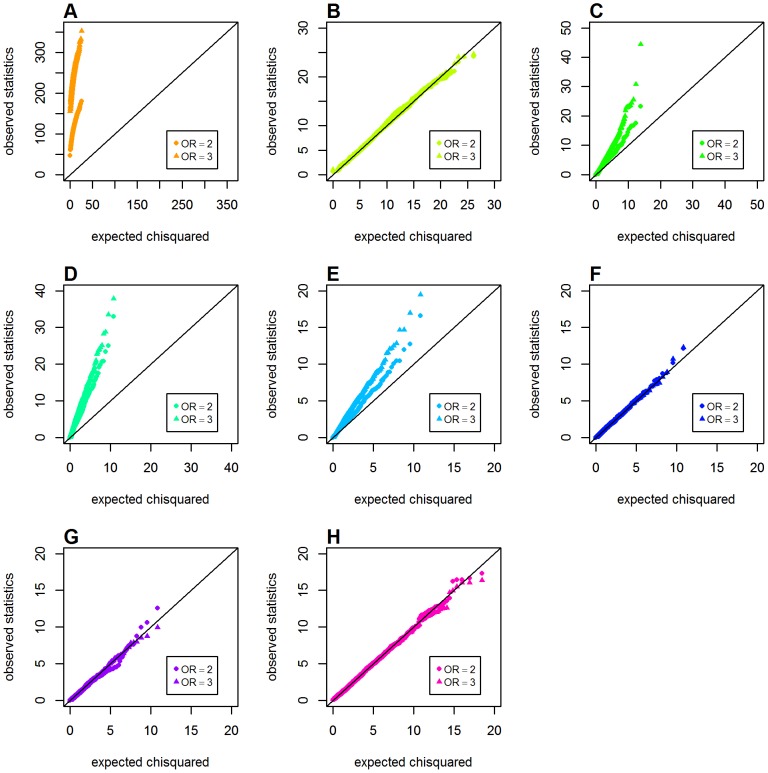
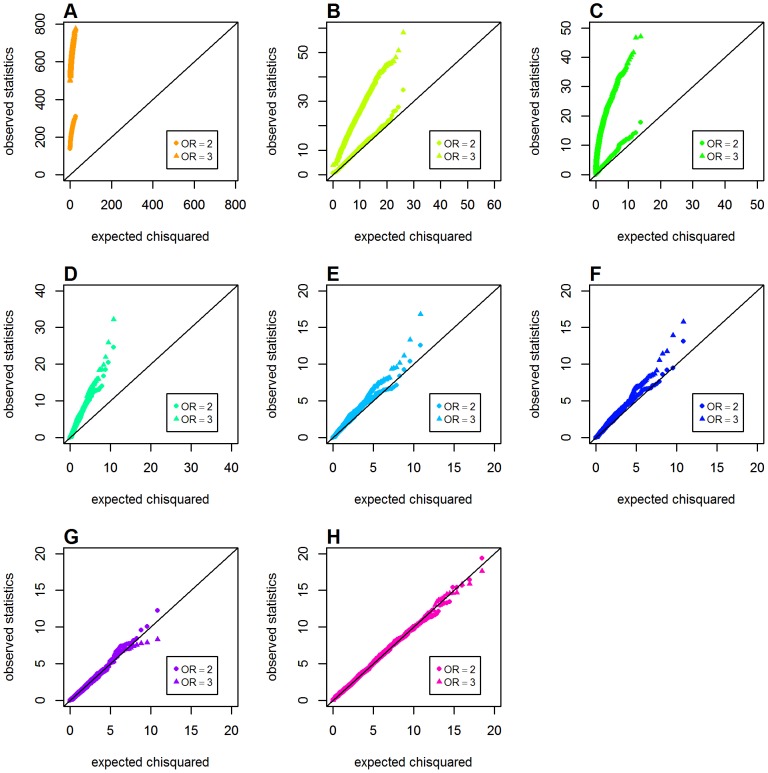
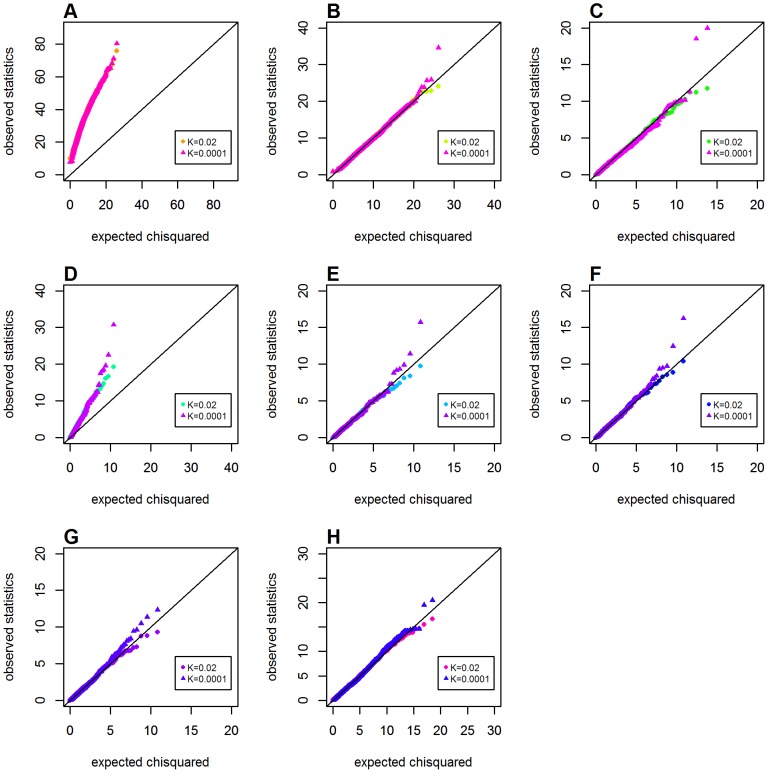
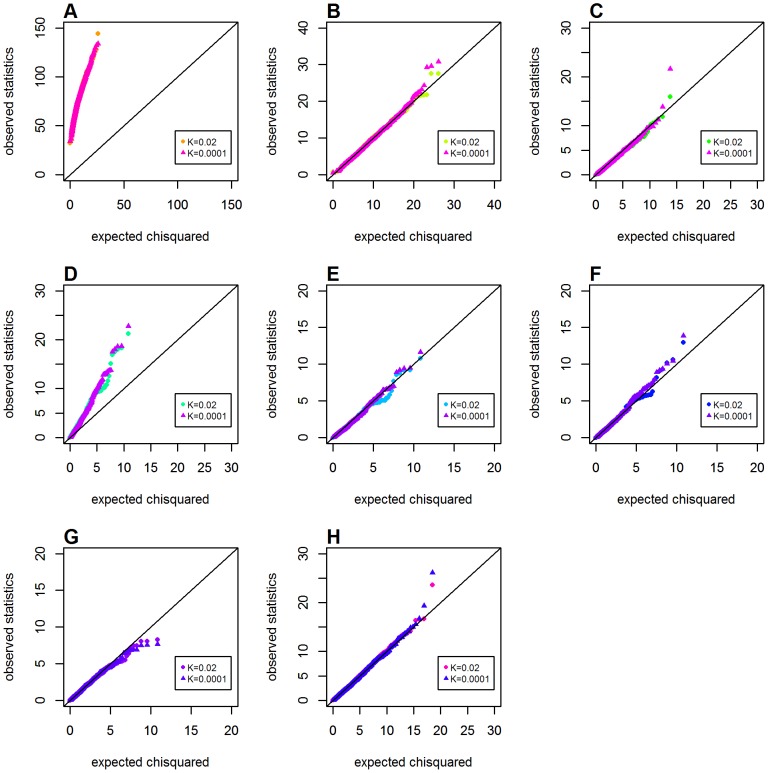
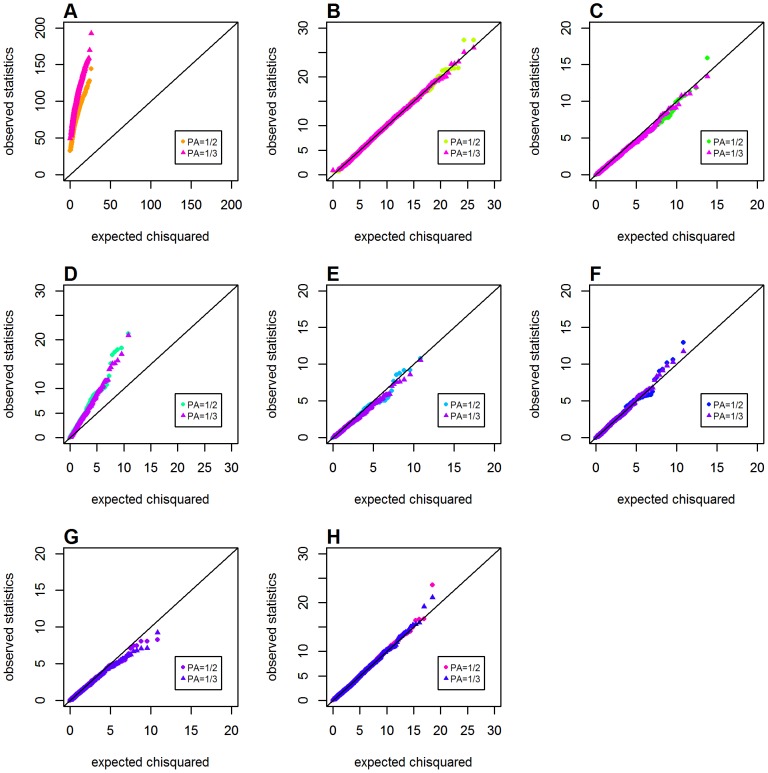
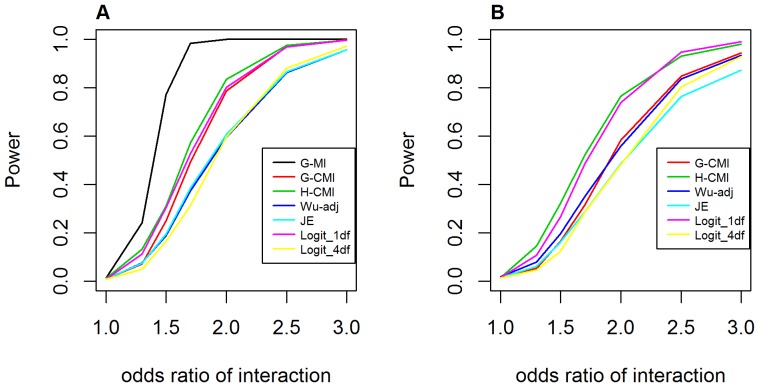
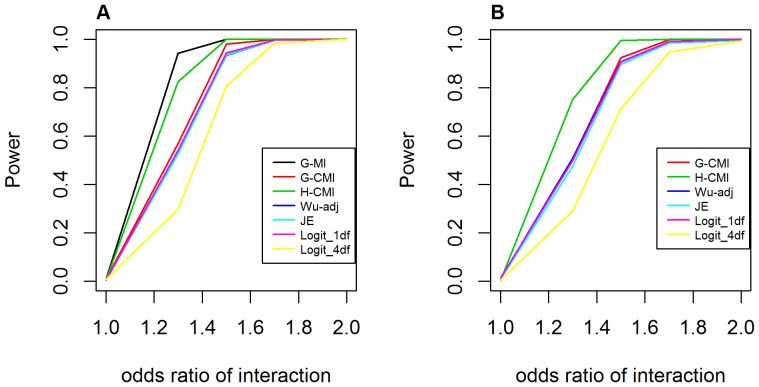
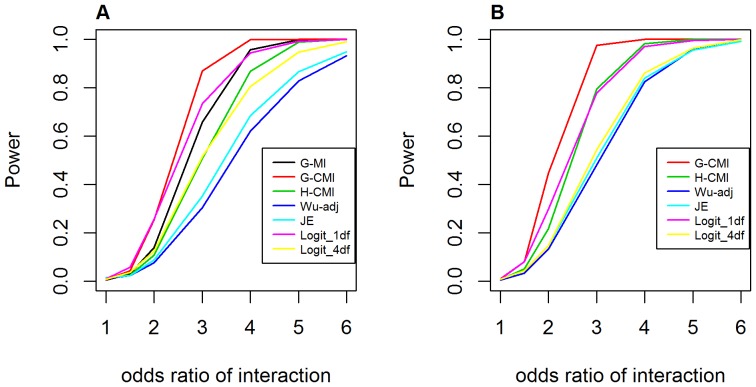
Genome-wide analysis of gene-gene interactions has been recognized as a powerful avenue to identify the missing genetic components that can not be detected by using current single-point association analysis. Recently, several model-free methods (e.g. the commonly used information based metrics and several logistic regression-based metrics) were developed for detecting non-linear dependence between genetic loci, but they are potentially at the risk of inflated false positive error, in particular when the main effects at one or both loci are salient. In this study, we proposed two conditional entropy-based metrics to challenge this limitation. Extensive simulations demonstrated that the two proposed metrics, provided the disease is rare, could maintain consistently correct false positive rate. In the scenarios for a common disease, our proposed metrics achieved better or comparable control of false positive error, compared to four previously proposed model-free metrics. In terms of power, our methods outperformed several competing metrics in a range of common disease models. Furthermore, in real data analyses, both metrics succeeded in detecting interactions and were competitive with the originally reported results or the logistic regression approaches. In conclusion, the proposed conditional entropy-based metrics are promising as alternatives to current model-based approaches for detecting genuine epistatic effects.


Conflict of interest statement

Competing Interests: The authors have declared that no competing interests exist.

Figures

Figure 1
Figure 1. Null distribution of the GenoCMI and GameteCMI metrics.
A. The empirically null distribution of GenoCMI, compared to its theoretical distribution χ 2 (8). B. The empirically null distribution of GameteCMI, compared to its theoretical distribution χ 2 (2).
Figure 2
Figure 2. Chi-squared Q-Q plots for the global null hypothesis (Schema 1).
Top panels: A. GenoMI; B. GenoCMI; C. GameteCMI. Middle panels: D. original Wu et al statistic; E. adjusted Wu statistic; F. joint effect statistic. Bottom panel: G. logistic regression model with 1 df test; H. logistic regression model with 4 df test.
Figure 3
Figure 3. Chi-squared Q-Q plots for the recessive model with main effect at one locus (Schema 2).
Top panels: A. GenoMI; B. GenoCMI; C. GameteCMI. Middle panels: D. original Wu et al statistic; E. adjusted Wu statistic; F. joint effect statistic. Bottom panel: G. logistic regression model with 1 df test; H. logistic regression model with 4 df test.
Figure 4
Figure 4. Chi-squared Q-Q plots for the recessive-recessive model with main effect at both locus (Schema 3).
Top panels: A. GenoMI; B. GenoCMI; C. GameteCMI. Middle panels: D. original Wu et al statistic; E. adjusted Wu statistic; F. joint effect statistic. Bottom panel: G. logistic regression model with 1 df test; H. logistic regression model with 4 df test.
Figure 5
Figure 5. Chi-squared Q-Q plots for the dominant-donimant model with main effect at both locus (Schema 3).
Top panels: A. GenoMI; B. GenoCMI; C. GameteCMI. Middle panels: D. original Wu et al statistic; E. adjusted Wu statistic; F. joint effect statistic. Bottom panel: G. logistic regression model with 1 df test; H. logistic regression model with 4 df test.
Figure 6
Figure 6. Chi-squared Q-Q plots for the additive-additive model with main effect at both locus (Schema 3).
Top panels: A. GenoMI; B. GenoCMI; C. GameteCMI. Middle panels: D. original Wu et al statistic; E. adjusted Wu statistic; F. joint effect statistic. Bottom panel: G. logistic regression model with 1 df test; H. logistic regression model with 4 df test.
Figure 7
Figure 7. Chi-squared Q-Q plots for the recessive model with main effect at one locus, when disease prevalence varied (Schema 4).
Assuming the presence of main effect at one locus (ORG = 2.0). Top panels: A. GenoMI; B. GenoCMI; C. GameteCMI. Middle panels: D. original Wu et al statistic; E. adjusted Wu statistic; F. joint effect statistic. Bottom panel: G. logistic regression model with 1 df test; H. logistic regression model with 4 df test.
Figure 8
Figure 8. Chi-squared Q-Q plots for the recessive-recessive model with main effect at both loci, when disease prevalence varied (Schema 5).
Assuming main effect at both locus (ORG = ORH = 2.0). Top panels: A. GenoMI; B. GenoCMI; C. GameteCMI. Middle panels: D. original Wu et al statistic; E. adjusted Wu statistic; F. joint effect statistic. Bottom panel: G. logistic regression model with 1 df test; H. logistic regression model with 4 df test.
Figure 9
Figure 9. Chi-squared Q-Q plots for the recessive-recessive model with main effect at both loci, when case/control ratios varied (Schema 7).
Assuming main effects at both locus (ORG = ORH = 2.0) and disease prevalence 0.02. Top panels: A. GenoMI; B. GenoCMI; C. GameteCMI. Middle panels: D. original Wu et al statistic; E. adjusted Wu statistic; F. joint effect statistic. Bottom panel: G. logistic regression model with 1 df test; H. logistic regression model with 4 df test.
Figure 10
Figure 10. Power curves for testing interaction under the dominant-dominant interaction model.
A. Assuming no main effect at both loci (ORG = ORH = 1.0); B. Assuming main effect at one locus (ORG = 2.0). G-MI: GenoMI; G-CMI: GenoCMI; H-CMI: GameteCMI; Wu-adj: Adjusted Wu statistics; JE: Joint Effects statistics; Logit_1 df: logistic regression model with 1 df test; Logit_4 df: logistic regression model with 4 df test. Disease prevalence was chosen at 0.02.
Figure 11
Figure 11. Power curves for testing interaction under the additive-additive interaction model.
A. Assuming no main effect at both loci (ORG = ORH = 1.0); B. Assuming main effect at one locus (ORG = 2.0). G-MI: GenoMI; G-CMI: GenoCMI; H-CMI: GameteCMI; Wu-adj: Adjusted Wu statistics; JE: Joint Effects statistics; Logit_1 df: logistic regression model with 1 df test; Logit_4 df: logistic regression model with 4 df test. Disease prevalence was chosen at 0.02.
Figure 12
Figure 12. Power curves for testing interaction under the recessive-recessive interaction model.
A. Assuming no main effect at both loci (ORG = ORH = 1.0); B. Assuming main effect at one locus (ORG = 2.0). G-MI: GenoMI; G-CMI: GenoCMI; H-CMI: GameteCMI; Wu-adj: Adjusted Wu statistics; JE: Joint Effects statistics; Logit_1 df: logistic regression model with 1 df test; Logit_4 df: logistic regression model with 4 df test. Disease prevalence was chosen at 0.02.

Similar articles

Cited by

References

    1. Schork NJ, Murray SS, Frazer KA, Topol EJ (2009) Common vs. rare allele hypotheses for complex diseases. Curr Opin Genet Dev 19: 212–219. - PMC - PubMed
    1. Kingsmore SF, Lindquist IE, Mudge J, Beavis WD (2007) Genome-wide association studies: progress in identifying genetic biomarkers in common, complex diseases. Biomark Insights 2: 283–292. - PMC - PubMed
    1. Hirschhorn JN, Daly MJ (2005) Genome-wide association studies for common diseases and complex traits. Nat Rev Genet 6: 95–108. - PubMed
    1. Witte JS (2010) Genome-wide association studies and beyond. Annu Rev Public Health 31: : 9–20 24 following 20. - PMC - PubMed
    1. Eichler EE, Flint J, Gibson G, Kong A, Leal SM, et al. (2010) Missing heritability and strategies for finding the underlying causes of complex disease. Nat Rev Genet 11: 446–450. - PMC - PubMed

Publication types

LinkOut - more resources