Clinical Trial
. 2013 Dec 5;8(12):e82107.
doi: 10.1371/journal.pone.0082107. eCollection 2013.

Spatio-temporal correlation tensors reveal functional structure in human brain

Affiliations
Clinical Trial

Spatio-temporal correlation tensors reveal functional structure in human brain

Zhaohua Ding et al. PLoS One. .

Abstract

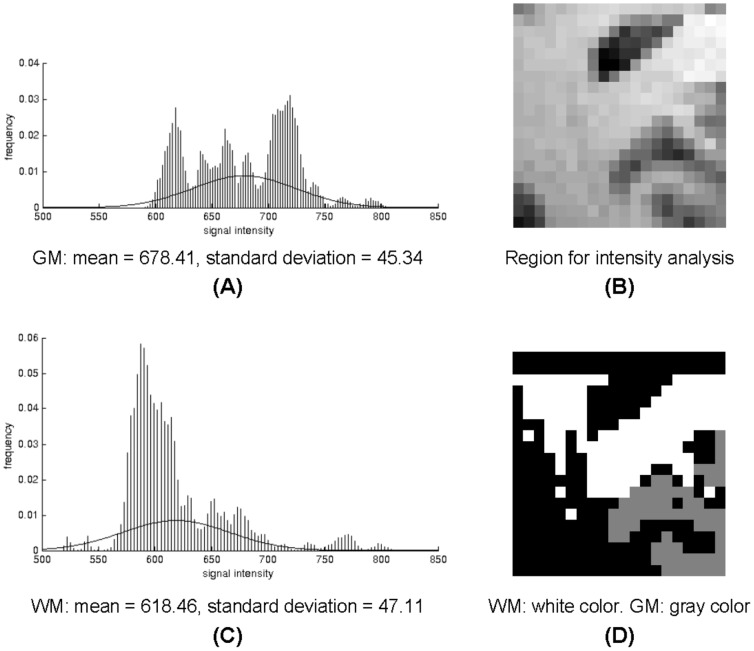
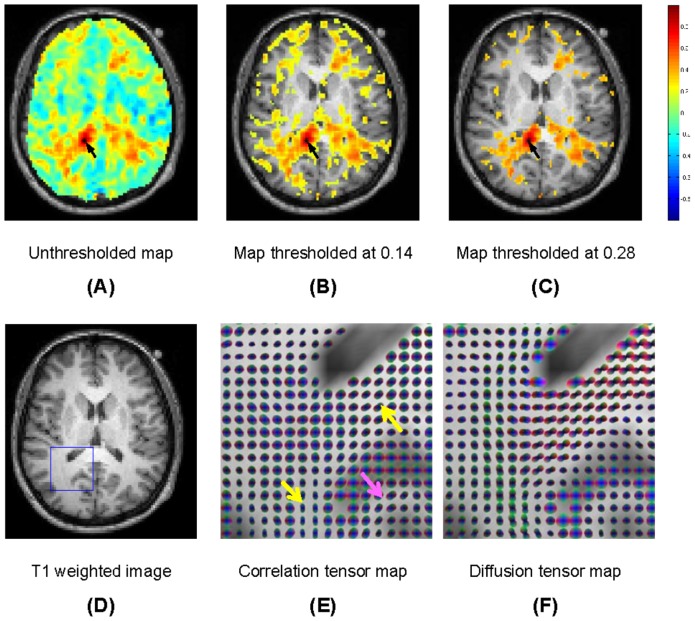
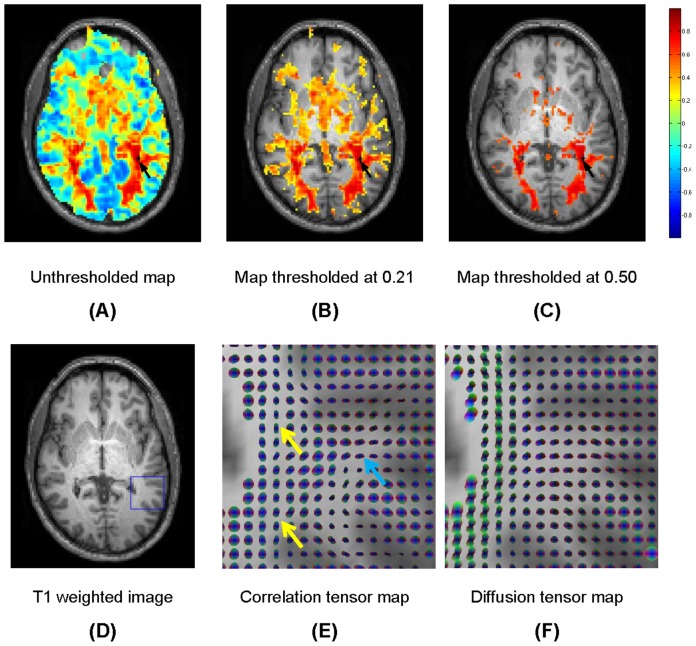
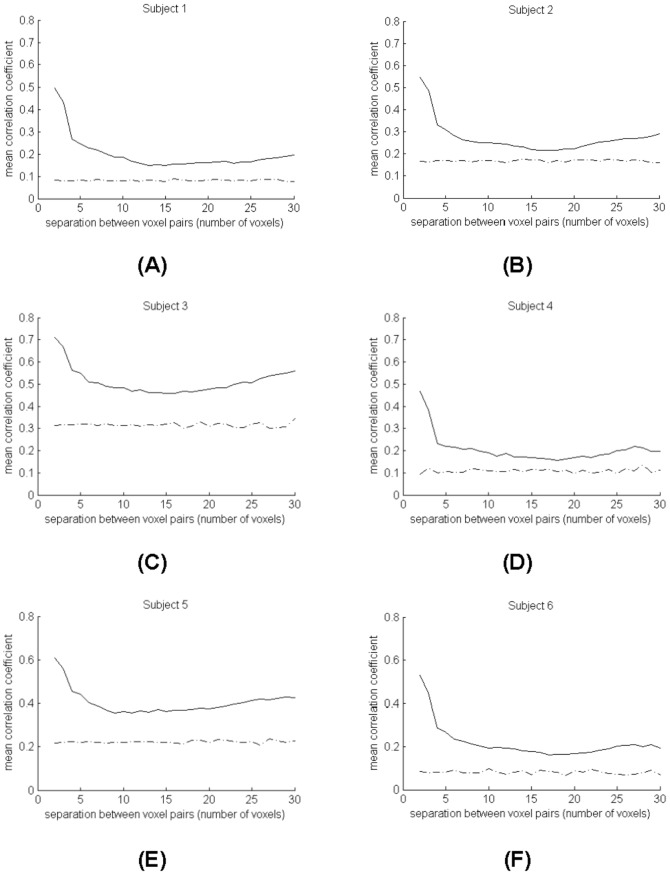
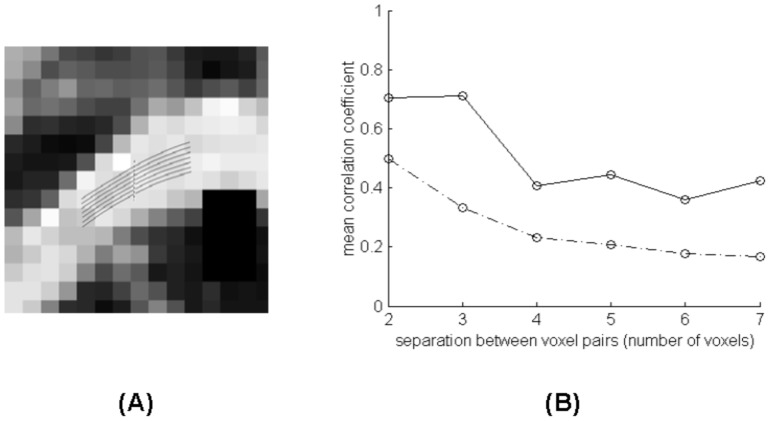
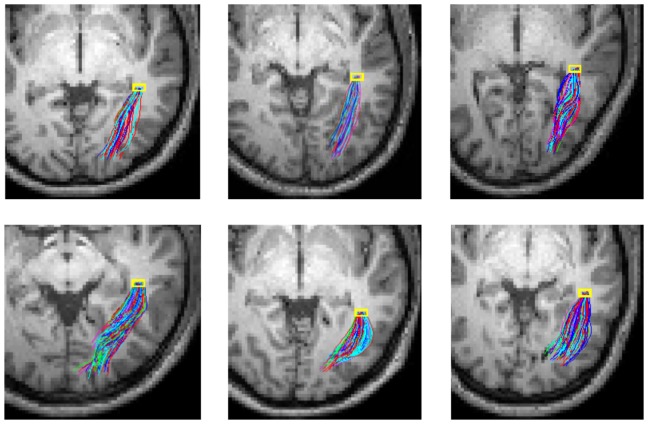
Resting state functional magnetic resonance imaging (fMRI) has been commonly used to measure functional connectivity between cortical regions, while diffusion tensor imaging (DTI) can be used to characterize structural connectivity of white matter tracts. In principle combining resting state fMRI and DTI data could allow characterization of structure-function relations of distributed neural networks. However, due to differences in the biophysical origins of their signals and in the tissues to which they apply, there has been no direct integration of these techniques to date. We demonstrate that MRI signal variations and power spectra in a resting state are largely comparable between gray matter and white matter, that there are temporal correlations of fMRI signals that persist over long distances within distinct white matter structures, and that neighboring intervoxel correlations of low frequency resting state signals showed distinct anisotropy in many regions. These observations suggest that MRI signal variations from within white matter in a resting state may convey similar information as their corresponding fluctuations of MRI signals in gray matter. We thus derive a local spatio-temporal correlation tensor which captures directional variations of resting-state correlations and which reveals distinct structures in both white and gray matter. This novel concept is illustrated with in vivo experiments in a resting state, which demonstrate the potential of the technique for mapping the functional structure of neural networks and for direct integration of structure-function relations in the human brain.


Conflict of interest statement

Competing Interests: The authors have declared that no competing interests exist.

Figures

Figure 1
Figure 1. Intensity profiles of BOLD signals in GM (A) and WM (C).
Image in (B) is an enlarged view of the boxed region in Fig. 3D, which is segmented into WM and GM using intensity thresholding (D). Cerebro-spinal fluid and regions of WM-GM intensity overlapping are denoted in black and excluded from analysis.
Figure 2
Figure 2. Power spectrum distribution in the slice shown in Fig. 3D.
The intensity represents the ratio of the power (i.e., squared Fourier coefficient) for the frequency f = 0.01–0.1 Hz to the total power for all frequencies at f>0.
Figure 3
Figure 3. Maps of temporal correlations of BOLD signals to a seed in the corpus callosum.
The background is the anatomic image. Shown from (A) to (C) are maps thresholded at different levels of temporal correlations (see text for explanations). Shown from (D) to (F) are respectively a slice of anatomic T1 weighted image, map of spatio-temporal correlation tensors and map of diffusion tensors for the region demarked in (D).
Figure 4
Figure 4. Maps of temporal correlations of BOLD signals to a seed in the left optic radiation.
See captions for Fig. 3 for explanations of the individual images.
Figure 5
Figure 5. Mean correlation coefficients along fiber tracts versus fiber length.
Each plot is for a different subject.
Figure 6
Figure 6. Detailed analysis of correlations along fiber segments tracked in the corpus callosum of Subject One.
The dashed line at the left denotes the seed plane for fiber tracking. The solid curve at the right is the mean correlation coefficient over the seven segments and the dash-dotted curve is the mean correlation coefficient over 1000 random pairs of voxels in the white matter separated by the same distance.
Figure 7
Figure 7. Reconstructed pathways of the left optic radiation of Subject Two.
Top row: probability density maps of four selected slices that contain the left optic radiation, superimposed onto the corresponding T1 weighted image. Bottom row: randomly colored pathways back tracked from density and mean direction maps, rendered in an axial view (B) and oblique view (C). The yellow squares denote the seed region.
Figure 8
Figure 8. Reconstructed pathways of the left optic radiation of all the six subjects studied.
The same set of parameters were used for probabilistic tracking in these subjects, and pathways are randomly colored and rendered in an axial view.

Similar articles

Cited by

References

    1. Ogawa S, Lee TM, Kay AR, Tank DW (1990) Brain magnetic resonance imaging with contrast dependent on blood oxygenation. Proc Natl Acad Sci USA 87: 9868–9872. - PMC - PubMed
    1. Gore JC (2003) Principles and practice of functional MRI of the human brain. J Clin Invest 112: 4–9. - PMC - PubMed
    1. Basser PJ, Mattiello J, LeBihan D (1994) MR diffusion tensor spectroscopy and imaging. Biophys J 66: 259–267. - PMC - PubMed
    1. Le Bihan D (2003) Looking into the functional architecture of the brain with diffusion MRI. Nat Rev Neurosci 4: 469–480. - PubMed
    1. Biswal B, Yetkin FZ, Haughton VM, Hyde JS (1995) Functional connectivity in the motor cortex of resting human brain using echo-planar MRI. Magn Reson Med 34: 537–541. - PubMed

Publication types