. 2013 Dec 10;8(12):e82388.
doi: 10.1371/journal.pone.0082388. eCollection 2013.

Vitamin a is a negative regulator of osteoblast mineralization

Affiliations

Vitamin a is a negative regulator of osteoblast mineralization

Thomas Lind et al. PLoS One. .

Abstract

An excessive intake of vitamin A has been associated with an increased risk of fractures in humans. In animals, a high vitamin A intake leads to a reduction of long bone diameter and spontaneous fractures. Studies in rodents indicate that the bone thinning is due to increased periosteal bone resorption and reduced radial growth. Whether the latter is a consequence of direct effects on bone or indirect effects on appetite and general growth is unknown. In this study we therefore used pair-feeding and dynamic histomorphometry to investigate the direct effect of a high intake of vitamin A on bone formation in rats. Although there were no differences in body weight or femur length compared to controls, there was an approximately halved bone formation and mineral apposition rate at the femur diaphysis of rats fed vitamin A. To try to clarify the mechanism(s) behind this reduction, we treated primary human osteoblasts and a murine preosteoblastic cell line (MC3T3-E1) with the active metabolite of vitamin A; retinoic acid (RA), a retinoic acid receptor (RAR) antagonist (AGN194310), and a Cyp26 inhibitor (R115866) which blocks endogenous RA catabolism. We found that RA, via RARs, suppressed in vitro mineralization. This was independent of a negative effect on osteoblast proliferation. Alkaline phosphatase and bone gamma carboxyglutamate protein (Bglap, Osteocalcin) were drastically reduced in RA treated cells and RA also reduced the protein levels of Runx2 and Osterix, key transcription factors for progression to a mature osteoblast. Normal osteoblast differentiation involved up regulation of Cyp26b1, the major enzyme responsible for RA degradation, suggesting that a drop in RA signaling is required for osteogenesis analogous to what has been found for chondrogenesis. In addition, RA decreased Phex, an osteoblast/osteocyte protein necessary for mineralization. Taken together, our data indicate that vitamin A is a negative regulator of osteoblast mineralization.


Conflict of interest statement

Competing Interests: The authors have declared that no competing interests exist.

Figures

Figure 1
Figure 1. Effects of a high vitamin A intake on serum levels, bone and body weight.
(A) Comparison of serum vitamin A levels, body weight, femur length and cross sectional area of mid diaphysis of femur, and (B) periosteal mineralizing surface, bone formation rate and mineral apposition rate as determined by histomorphometric analysis of calcein double-labeled bones in rats with a high vitamin A intake and pair-fed controls. Means +/– SEM, * p<0.05 vs Control.
Figure 2
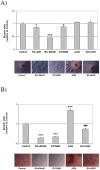
Figure 2. The effect of RA and RAR signaling on osteoblast mineralization in vitro.
(A) Representative diagram of quantification of Alizarin Red stain in primary human osteoblasts (from a single individual) treated with RA at 4 and 400 nM, a Cyp26 inhibitor (R115866, 5 µM) and a pan-RAR antagonist (AGN, 1 µM) and 400 nM RA + AGN for 25 days. Below are representative photographs of the cultures. (B) Alizarin Red stain quantification of the mouse preosteoblast cell line MC3T3-E1 treated with RA at 400 nM, a Cyp26 inhibitor (R115866, 5 µM) and a pan-RAR antagonist (AGN, 1 µM) and 400 nM RA + AGN for 25 days. Below are representative photographs of the cultures. Means +/– SD, not significant (ns), * p<0.05 and *** p<0.001, vs Control, and ### p<0.001 vs RA.
Figure 3
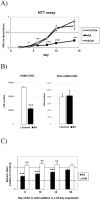
Figure 3. RA and RAR-dependent effects on osteoblast proliferation and on treatment start during in vitro mineralization.
(A) Cell proliferation of MC3T3-E1 cells, treated with 400 nM RA or 1 µM AGN during the first 14 days of a mineralization experiment. (B) Cell number of viable and non-viable MC3T3-E1 cells after 10 days, with or without 400 nM RA. (C) Alizarin Red stain quantification of MC3T3-E1 cells, treated with 400 nM RA or 1 µM AGN from day 0, 10, 14 or 18 followed by analysis at day 25. Control mineralization level is set at 1 and dotted line represent background (no osteogenic induction). Means +/– SD, * p<0.05, ** p<0.01 and *** p<0.001 vs Control.
Figure 4
Figure 4. QRT-PCR analysis of genes associated with osteoblast differentiation and endogenous RA degradation.
(A) Expression levels of mRNA for Alpl (alkaline phosphatase, liver/bone/kidney) and Bglap (Osteocalcin) during a mineralization experiment of MC3T3-E1 cells treated with 400 nM RA or 1 µM AGN. (B) mRNA expression of Cyp26b1 at day 1, treated as in (A). (C) mRNA expression of Cyp26b1 at day 1, 3, 7, 14 and 21 of a mineralization experiment of MC3T3-E1 cells +/– 1 µM AGN. Means +/– SD, * p<0.05, ** p<0.01 and *** p<0.001 RA vs Control. # p<0.05, ## p<0.01 and ### p<0.001 AGN vs Control. ¤ p<0.05 and ¤¤¤ p<0.001 vs Control day 1.
Figure 5
Figure 5. Runx2 and Sp7 (Osterix) levels in RA and RAR antagonist treated MC3T3-E1 cells.
(A) QRT-PCR analysis of Runx2 and Sp7 (Osterix) expression at day 3, 7 and 14 of cells treated with 400 nM RA or 1 µM AGN. (B) Representative Western blot analysis of Runx2 and Osterix at day 3, 7 and 14 of cells treated as in (A) and quantification of the Western bands relative to Actb (relative ratio). Means +/– SD, ** p<0.01 and *** p<0.001, RA vs Control, and # p<0.05, ## p<0.01 AGN vs Control.
Figure 6
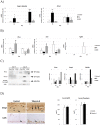
Figure 6. Osteocyte markers in RA and RAR antagonist treated MC3T3-E1 cells and periosteal and serum phenotype in vitamin A treated rats.
QRT-PCR analysis of Tnfsf11 (RANKL) and Dmp1, (A) Phex, Sost and Fgf23 (B) expression at day 14 and 21 during a mineralization experiment of MC3T3-E1 cells treated with 400 nM RA or 1 µM AGN. (C) Representative Western blot analysis of Phex, Dmp1 and full length RANKL at day 14 and 21 of MC3T3-E1 cells treated as in (A) and quantification of Western bands relative to Actb (relative ratio). (D) Dmp1 and Cathepsin K (CatK) immunohistochemical staining at the diaphyseal periosteal site in rats suffering from hypervitaminosis A and in control rats. Upper panel: Arrow heads indicate Dmp1 negative osteocytes close to the periosteum (Ps) in control rat bone and arrows indicate Dmp1 positive osteocytes close to the periosteum in hypervitaminosis A rat bone. Lower panel: only Vitamin A animals show clear CatK staining at the Ps site. (E) Serum Fgf23 and phosphate levels in rats from (D). Means +/– SD, * p<0.05, ** p<0.01 and *** p<0.001 RA vs Control. # p<0.05, ## p<0.01 AGN vs Control.

Similar articles

Cited by

References

    1. Melhus H, Michaëlsson K, Kindmark A, Bergström R, Holmberg L, et al. (1998) Excessive dietary intake of vitamin A is associated with reduced bone mineral density and increased risk for hip fracture. Ann Intern Med 129: 770–778. - PubMed
    1. Michaëlsson K, Lithell H, Vessby B, Melhus H (2003) Serum retinol levels and the risk of fracture. N Engl J Med 348: 287–294. - PubMed
    1. Feskanich D, Singh V, Willett WC, Colditz GA (2002) Vitamin A intake and hip fractures among postmenopausal women. JAMA 287: 47–54. - PubMed
    1. Binkley N, Krueger D (2000) Hypervitaminosis A and bone. Nutr Rev 58: 138–144. - PubMed
    1. Johansson S, Lind PM, Hakansson H, Oxlund H, Orberg J, et al. (2002) Subclinical hypervitaminosis A causes fragile bones in rats. Bone 31: 685–689. - PubMed

Publication types

MeSH terms

Substances