

The burden of cholera in Uganda
- PMID: 24340106
- PMCID: PMC3855006
- DOI: 10.1371/journal.pntd.0002545
The burden of cholera in Uganda
Abstract
Introduction: In 2010, the World Health Organization released a new cholera vaccine position paper, which recommended the use of cholera vaccines in high-risk endemic areas. However, there is a paucity of data on the burden of cholera in endemic countries. This article reviewed available cholera surveillance data from Uganda and assessed the sufficiency of these data to inform country-specific strategies for cholera vaccination.
Methods: The Uganda Ministry of Health conducts cholera surveillance to guide cholera outbreak control activities. This includes reporting the number of cases based on a standardized clinical definition plus systematic laboratory testing of stool samples from suspected cases at the outset and conclusion of outbreaks. This retrospective study analyzes available data by district and by age to estimate incidence rates. Since surveillance activities focus on more severe hospitalized cases and deaths, a sensitivity analysis was conducted to estimate the number of non-severe cases and unrecognized deaths that may not have been captured.
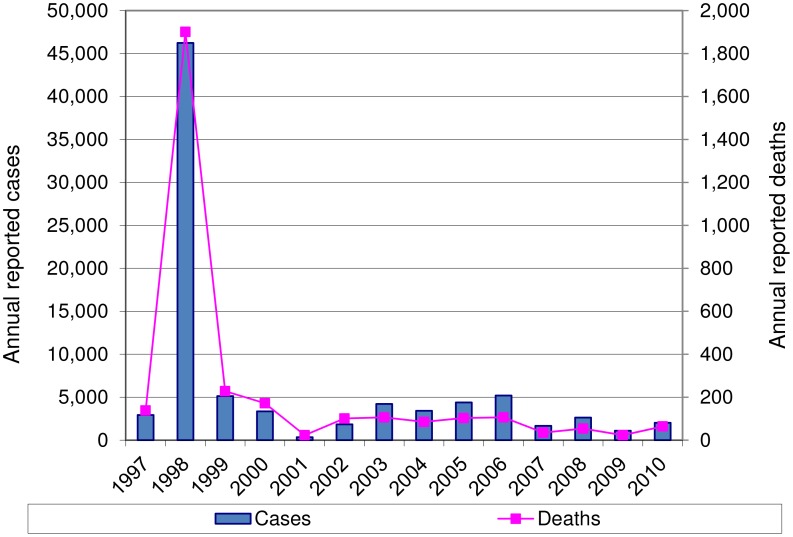
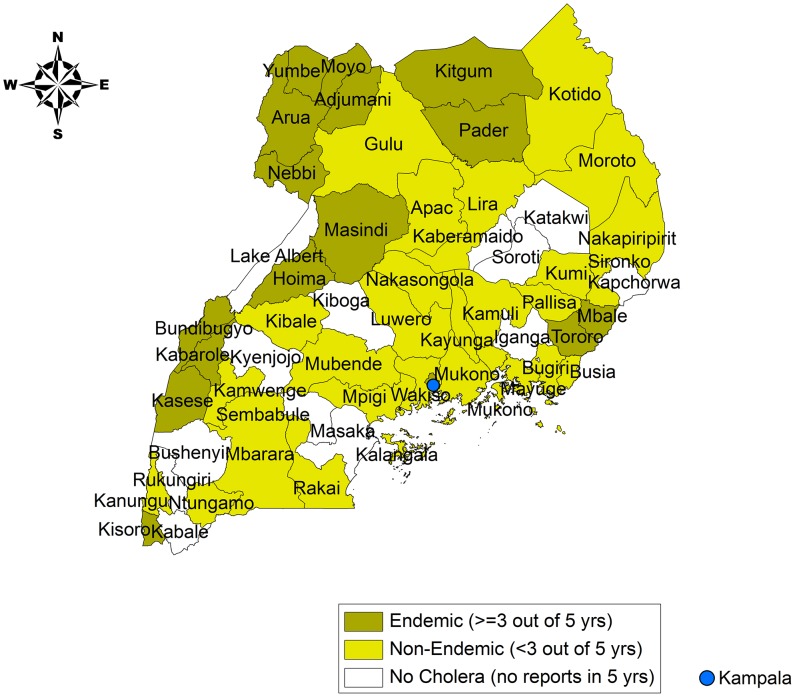
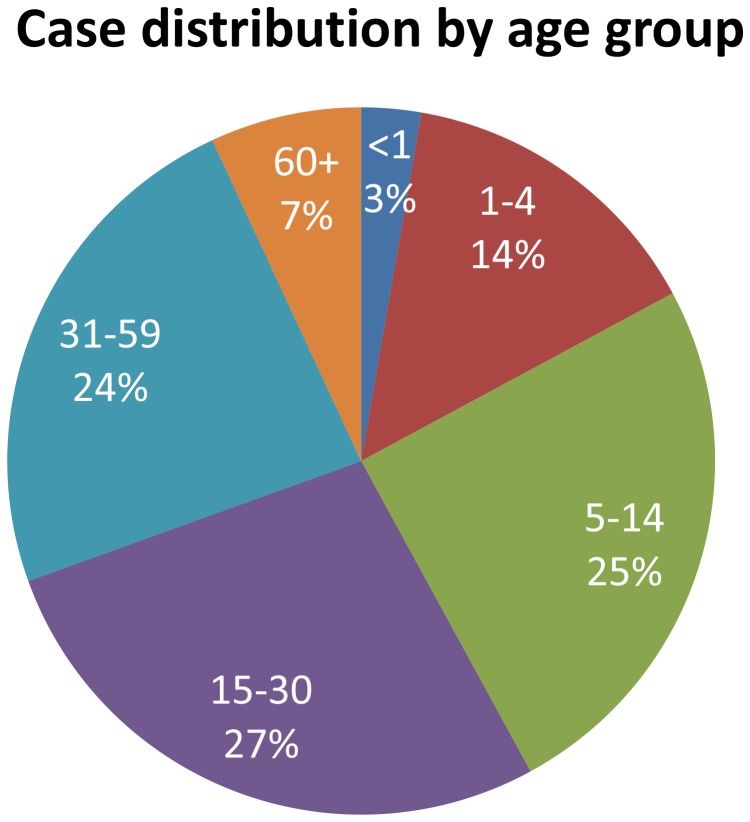
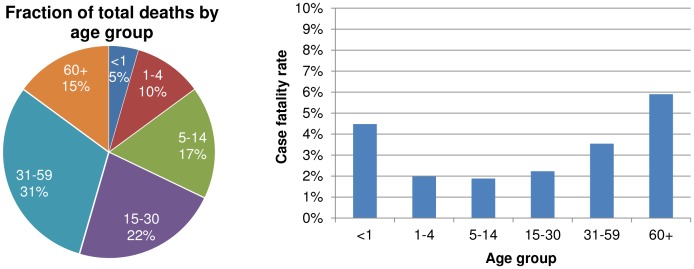
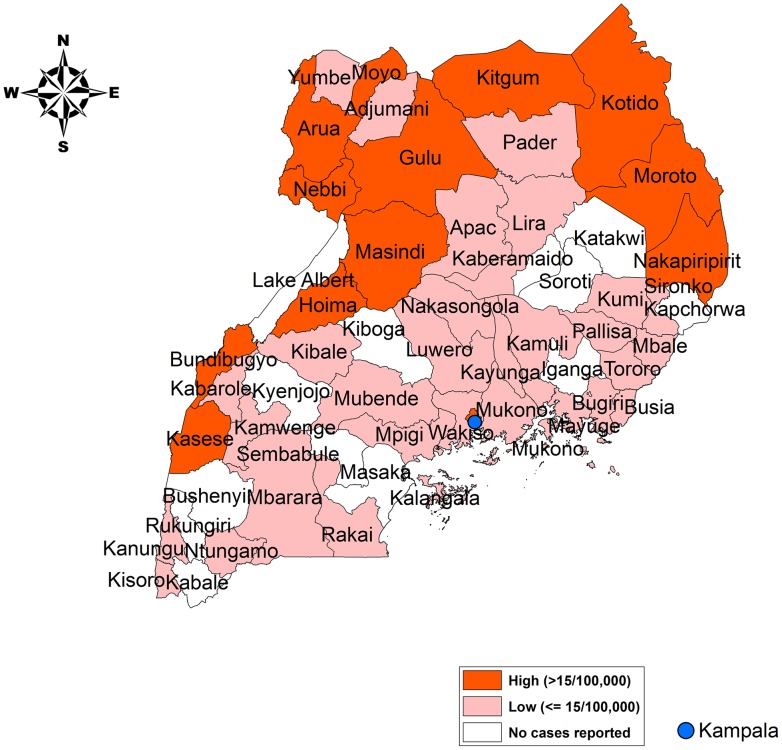
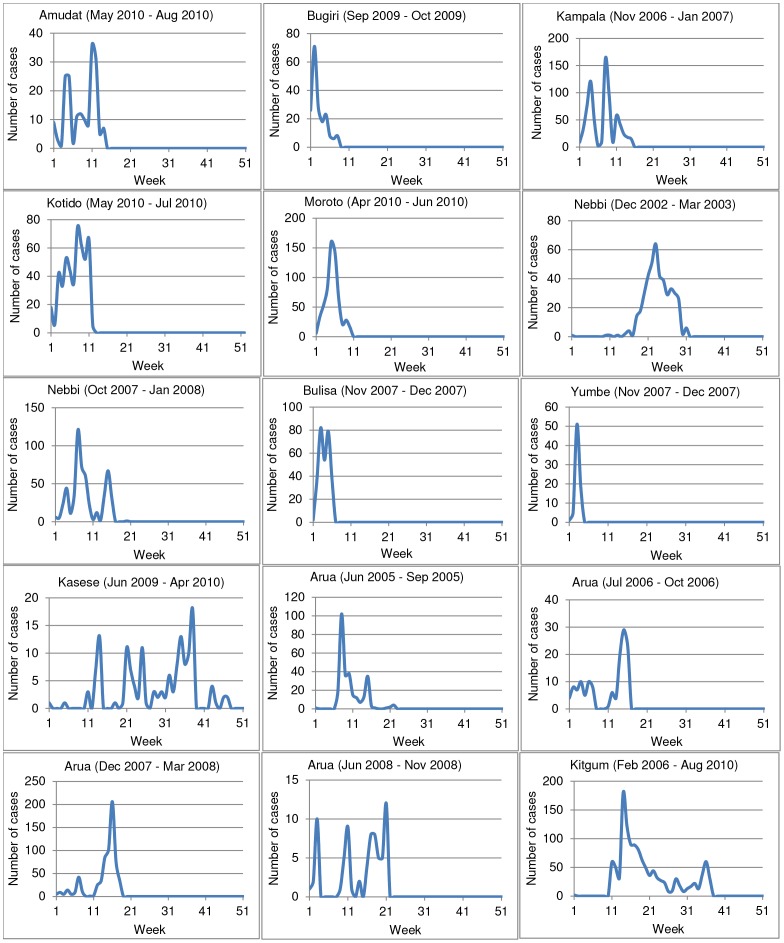
Results: Cholera affected all ages, but the geographic distribution of the disease was very heterogeneous in Uganda. We estimated that an average of about 11,000 cholera cases occurred in Uganda each year, which led to approximately 61-182 deaths. The majority of these cases (81%) occurred in a relatively small number of districts comprising just 24% of Uganda's total population. These districts included rural areas bordering the Democratic Republic of Congo, South Sudan, and Kenya as well as the slums of Kampala city. When outbreaks occurred, the average duration was about 15 weeks with a range of 4-44 weeks.
Discussion: There is a clear subdivision between high-risk and low-risk districts in Uganda. Vaccination efforts should be focused on the high-risk population. However, enhanced or sentinel surveillance activities should be undertaken to better quantify the endemic disease burden and high-risk populations prior to introducing the vaccine.
Conflict of interest statement
The authors have declared that no competing interests exist.
Figures
References
-
- World Health Organization (2000) Report on Global Surveillance on epidemic prone infectious diseases, WHO/CDS/CSR/ISR/2000.1 http://www.who.int/csr/resources/publications/surveillance/en/cholera.pdf accessed on July 1, 2012.
-
- Legros D, McCormick M, Mugero C, Skinnider M, Bek'obita D, et al. (2000) Epidemiology of cholera outbreak in Kampala, Uganda. East African Medical Journal 77: 347–349. - PubMed
-
- World Health Organization (2010) Cholera vaccines: WHO position paper. Weekly Epidemiological Record 13: 117–128.
-
- World Health Organization (2010) Cholera, 2009. Weekly Epidemiological Record 85: 293–308.
Publication types
MeSH terms
Substances
LinkOut - more resources
Full Text Sources
Other Literature Sources
Medical
