

A consensus surface activation marker signature is partially dependent on human immunodeficiency virus type 1 Nef expression within productively infected macrophages
- PMID: 24341794
- PMCID: PMC3883119
- DOI: 10.1186/1742-4690-10-155
A consensus surface activation marker signature is partially dependent on human immunodeficiency virus type 1 Nef expression within productively infected macrophages
Abstract
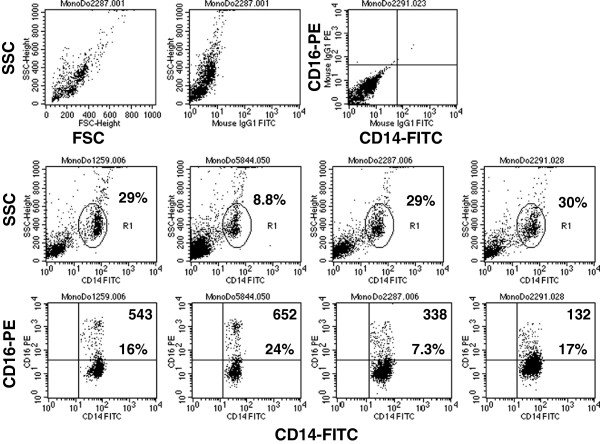
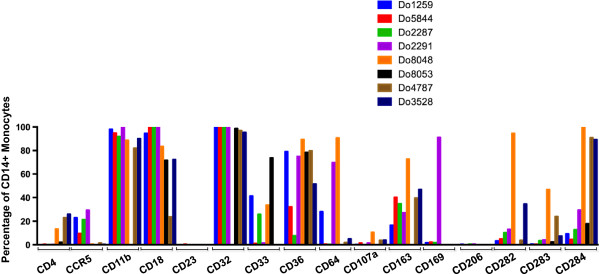
Background: The high prevalence of HIV-associated comorbidities including neurocognitive disorder, high levels of residual inflammatory mediators in the plasma and cerebrospinal fluid and the resurgence of HIV replication upon interruption of antiviral treatment in HIV-1 infected individuals, strongly suggests that despite therapy HIV persists in its cellular targets which include T-lymphocytes and cells of the myeloid lineage. These reservoirs present a major barrier against eradication efforts. Knowledge of the molecular mechanisms used by HIV to modulate innate macrophage immune responses and impair viral clearance is quite limited. To explore the role of HIV in potentially modulating macrophage function through changes in protein expression, we used single-cell analyses with flow cytometry to determine whether, in unpolarized cultures, macrophage surface marker phenotype was altered by HIV infection in a manner that was independent of host genetic background.
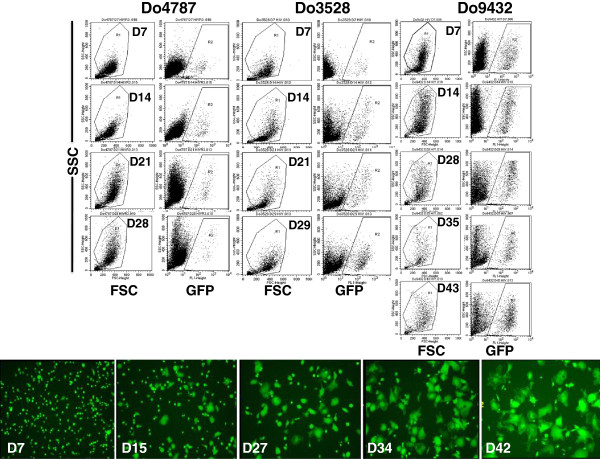
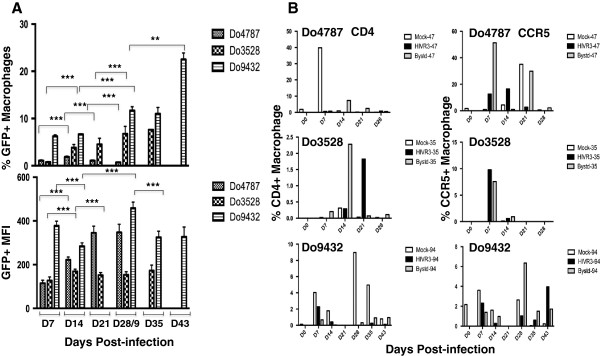
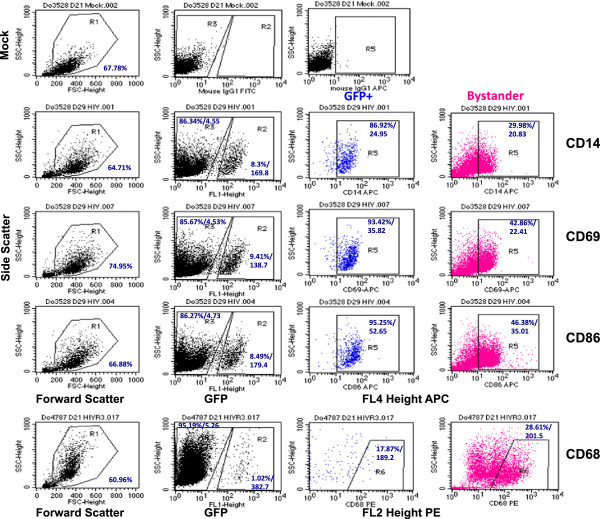
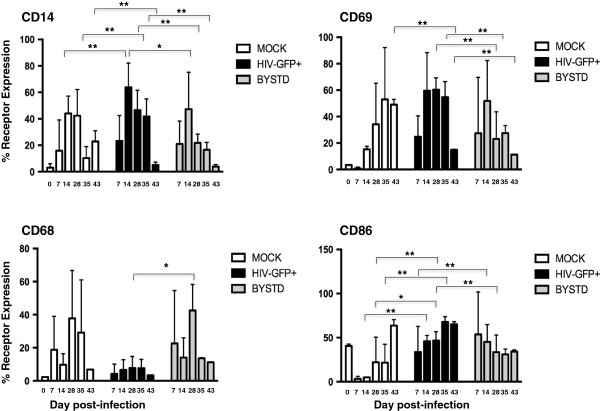
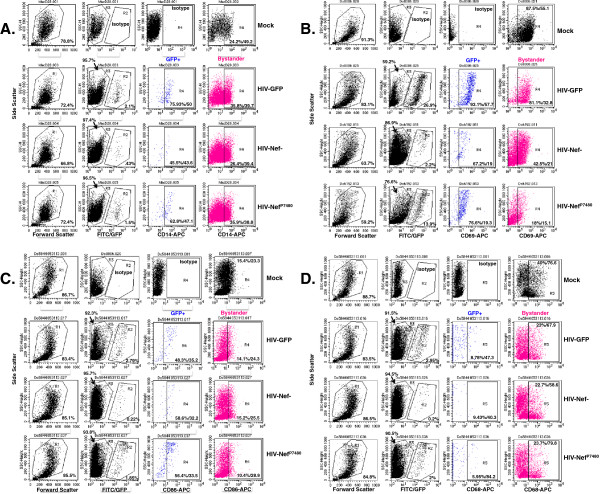
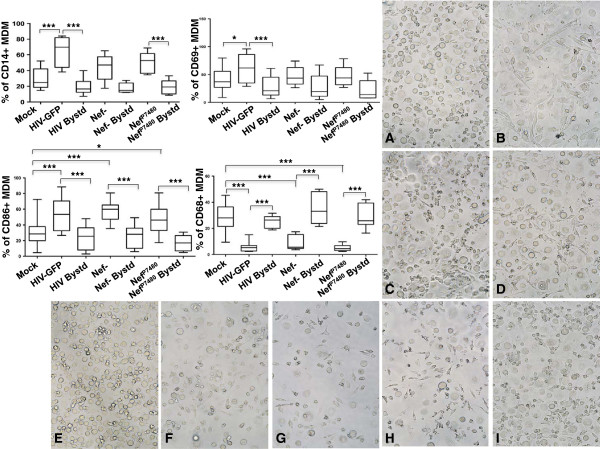
Results: These analyses revealed that at several time points post-infection, GFP + HIV-infected macrophages were significantly enriched in the CD14+ fraction (3 to 5-fold, p = .0001) compared to bystander, or uninfected cells in the same culture. However, the enrichment and higher levels of CD14 on HIV expressing macrophages did not depend on the production of HIV Nef. Sixty to eighty percent of macrophages productively infected with HIV after day 28 post-infection were also enriched in the population of cells expressing the activation markers CD69 (2 to 4-fold, p < .0001) and CD86 (2 to 4-fold, p < .0001 ) but suppressed amounts of CD68 (3 to 10-fold, p < .0001) compared to bystander cells. Interestingly, there was no enrichment of CD69 on the surface of HIV producing cells that lacked Nef or expressed a variant of Nef mutated in its SH3-binding domain.
Conclusions: These findings suggest that HIV actively regulates the expression of a subset of surface molecules involved in innate and inflammatory immune signaling in primary human macrophages through Nef-dependent and Nef-independent mechanisms acting within productively infected cells.
Figures

Similar articles
-
HLA-A2 down-regulation on primary human macrophages infected with an M-tropic EGFP-tagged HIV-1 reporter virus.J Leukoc Biol. 2005 Sep;78(3):675-85. doi: 10.1189/jlb.0505237. Epub 2005 Jul 6. J Leukoc Biol. 2005. PMID: 16000390
-
Resistance to apoptosis in HIV-infected CD4+ T lymphocytes is mediated by macrophages: role for Nef and immune activation in viral persistence.J Immunol. 2000 Dec 1;165(11):6437-46. doi: 10.4049/jimmunol.165.11.6437. J Immunol. 2000. PMID: 11086083
-
Induction of Heme Oxygenase-1 Deficiency and Associated Glutamate-Mediated Neurotoxicity Is a Highly Conserved HIV Phenotype of Chronic Macrophage Infection That Is Resistant to Antiretroviral Therapy.J Virol. 2015 Oct;89(20):10656-67. doi: 10.1128/JVI.01495-15. Epub 2015 Aug 12. J Virol. 2015. PMID: 26269184 Free PMC article.
-
Nef performance in macrophages: the master orchestrator of viral persistence and spread.Curr HIV Res. 2011 Oct;9(7):505-13. doi: 10.2174/157016211798842080. Curr HIV Res. 2011. PMID: 22103834 Review.
-
Nef: a pleiotropic modulator of primate lentivirus infectivity and pathogenesis.Acta Microbiol Immunol Hung. 2006 Mar;53(1):51-75. doi: 10.1556/AMicr.53.2006.1.4. Acta Microbiol Immunol Hung. 2006. PMID: 16696550 Review.
Cited by
-
ATP Evokes Ca2+ Responses and CXCL5 Secretion via P2X4 Receptor Activation in Human Monocyte-Derived Macrophages.J Immunol. 2018 Feb 1;200(3):1159-1168. doi: 10.4049/jimmunol.1700965. Epub 2017 Dec 18. J Immunol. 2018. PMID: 29255078 Free PMC article.
-
Understanding the MIND phenotype: macrophage/microglia inflammation in neurocognitive disorders related to human immunodeficiency virus infection.Clin Transl Med. 2015 Feb 26;4:7. doi: 10.1186/s40169-015-0049-2. eCollection 2015. Clin Transl Med. 2015. PMID: 25852823 Free PMC article.
-
Semen exosomes inhibit HIV infection and HIV-induced proinflammatory cytokine production independent of the activation state of primary lymphocytes.FEBS Lett. 2020 Feb;594(4):695-709. doi: 10.1002/1873-3468.13653. Epub 2019 Dec 2. FEBS Lett. 2020. PMID: 31665815 Free PMC article.
References
-
- Finzi D, Blankson J, Siliciano JD, Margolick JB, Chadwick K, Pierson T, Smith K, Lisziewicz J, Lori F, Flexner C. et al.Latent infection of CD4+ T cells provides a mechanism for lifelong persistence of HIV-1, even in patients on effective combination therapy. Nat Med. 1999;10:512–517. doi: 10.1038/8394. - DOI - PubMed
-
- Kannan K, Stewart RM, Bounds W, Carlsson SR, Fukuda M, Betzing KW, Holcombe RF. Lysosome-associated membrane proteins h-LAMP1 (CD107a) and h-LAMP2 (CD107b) are activation-dependent cell surface glycoproteins in human peripheral blood mononuclear cells which mediate cell adhesion tovascular endothelium. Cellular Immunol. 1996;10:10–19. doi: 10.1006/cimm.1996.0167. - DOI - PubMed
Publication types
MeSH terms
Substances
Grants and funding
LinkOut - more resources
Full Text Sources
Other Literature Sources
Research Materials
