. 2014 Jan:91:8-21.
doi: 10.1016/j.mvr.2013.12.003. Epub 2013 Dec 14.

A bioimage informatics based reconstruction of breast tumor microvasculature with computational blood flow predictions

Affiliations

A bioimage informatics based reconstruction of breast tumor microvasculature with computational blood flow predictions

Spyros K Stamatelos et al. Microvasc Res. 2014 Jan.

Abstract

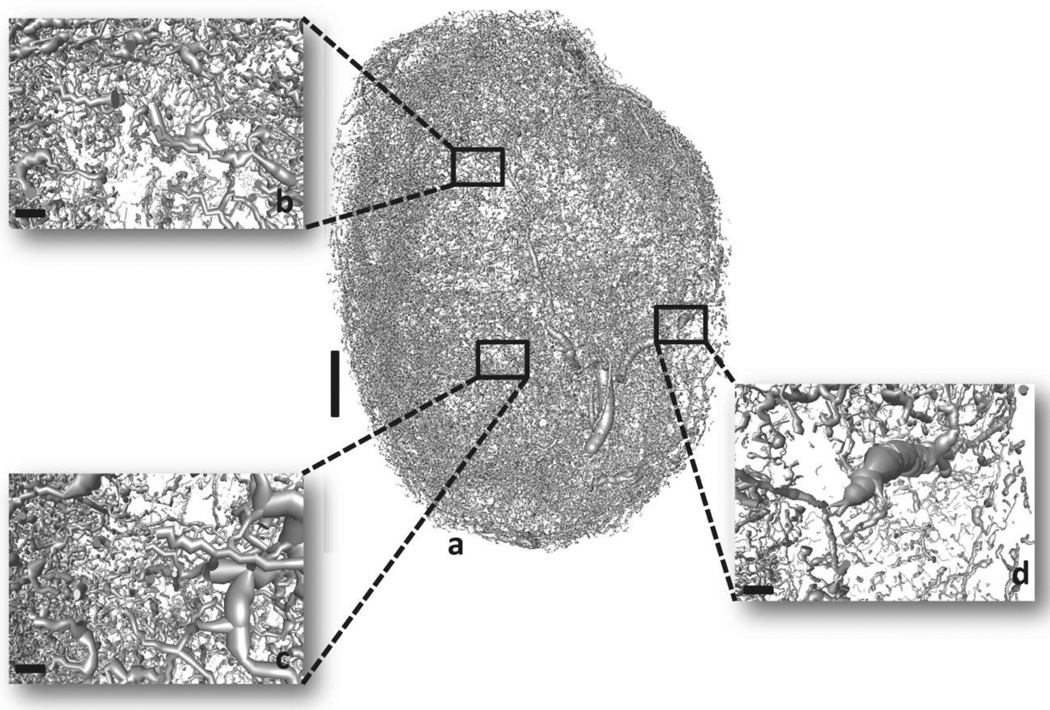
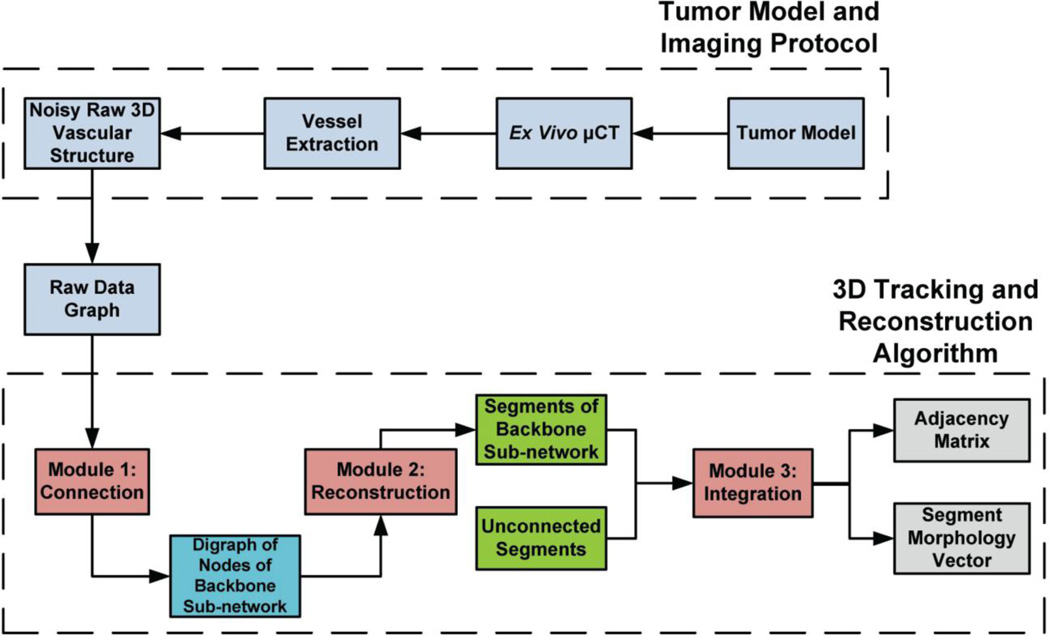
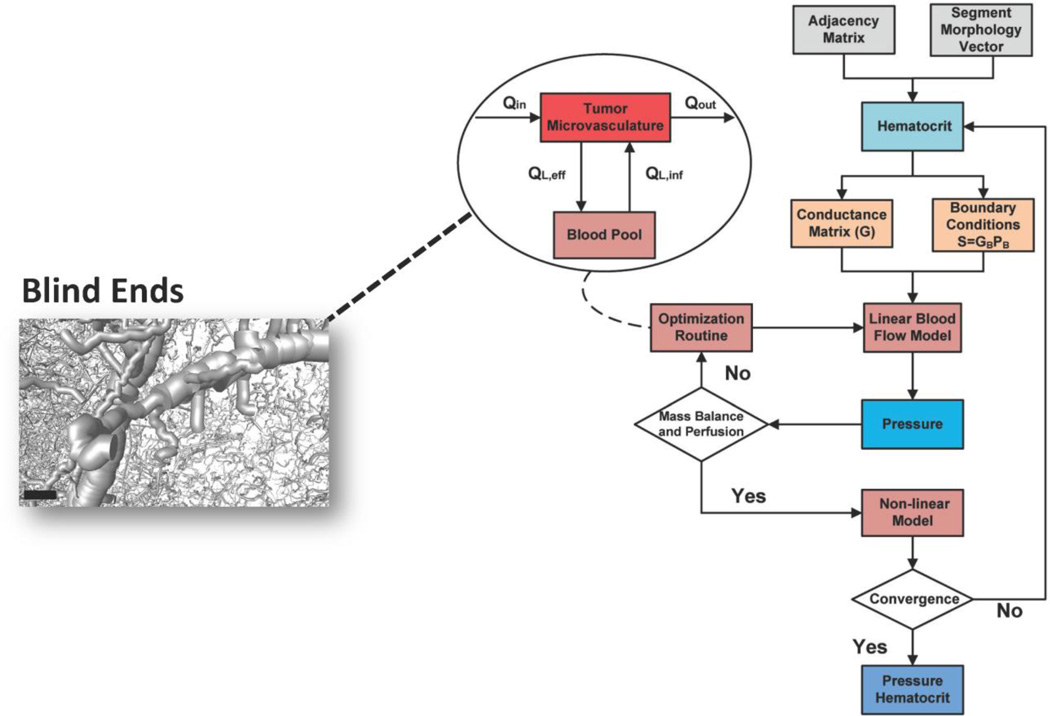
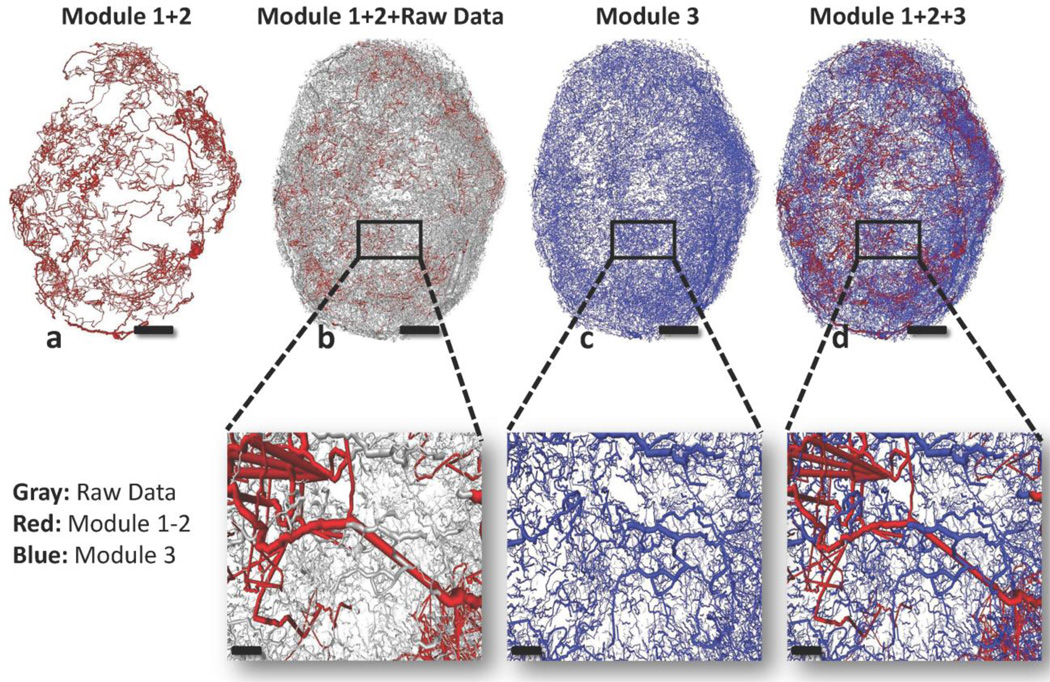
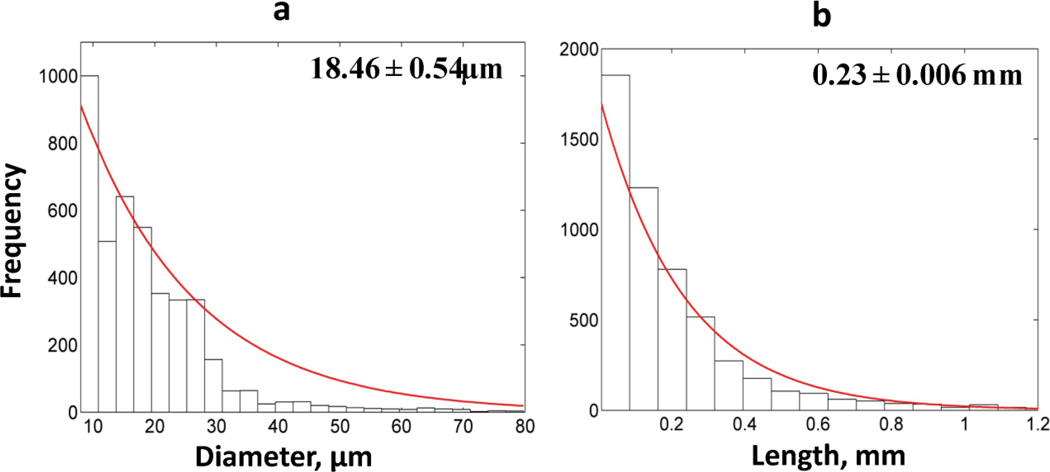
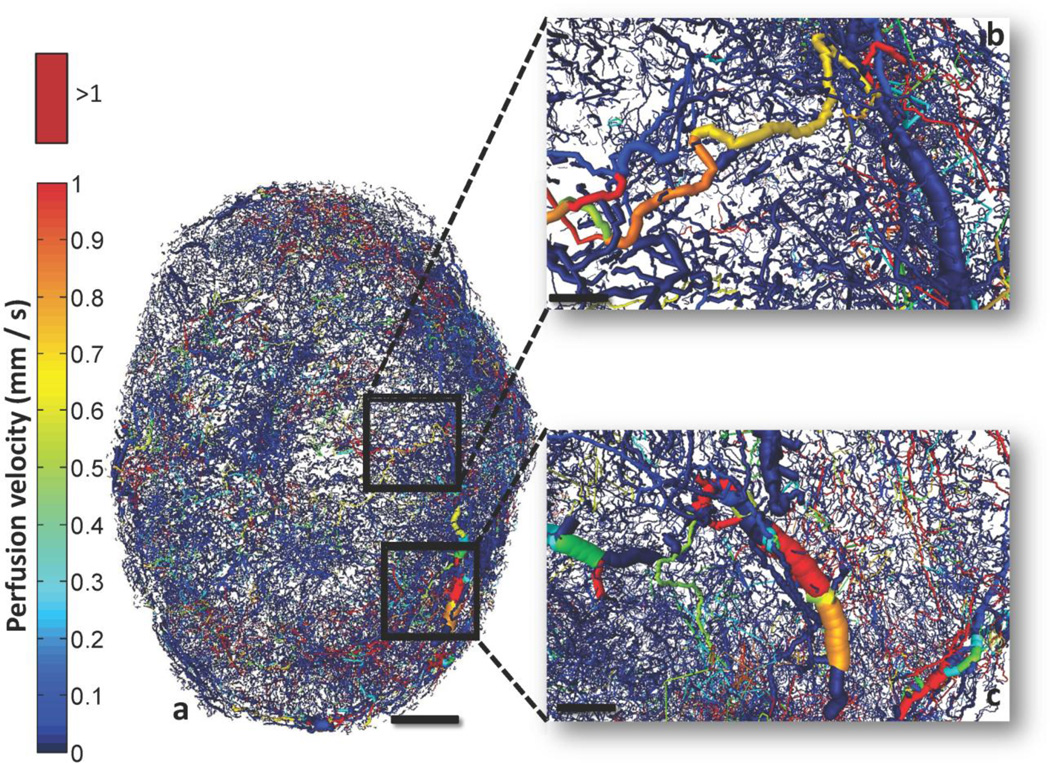
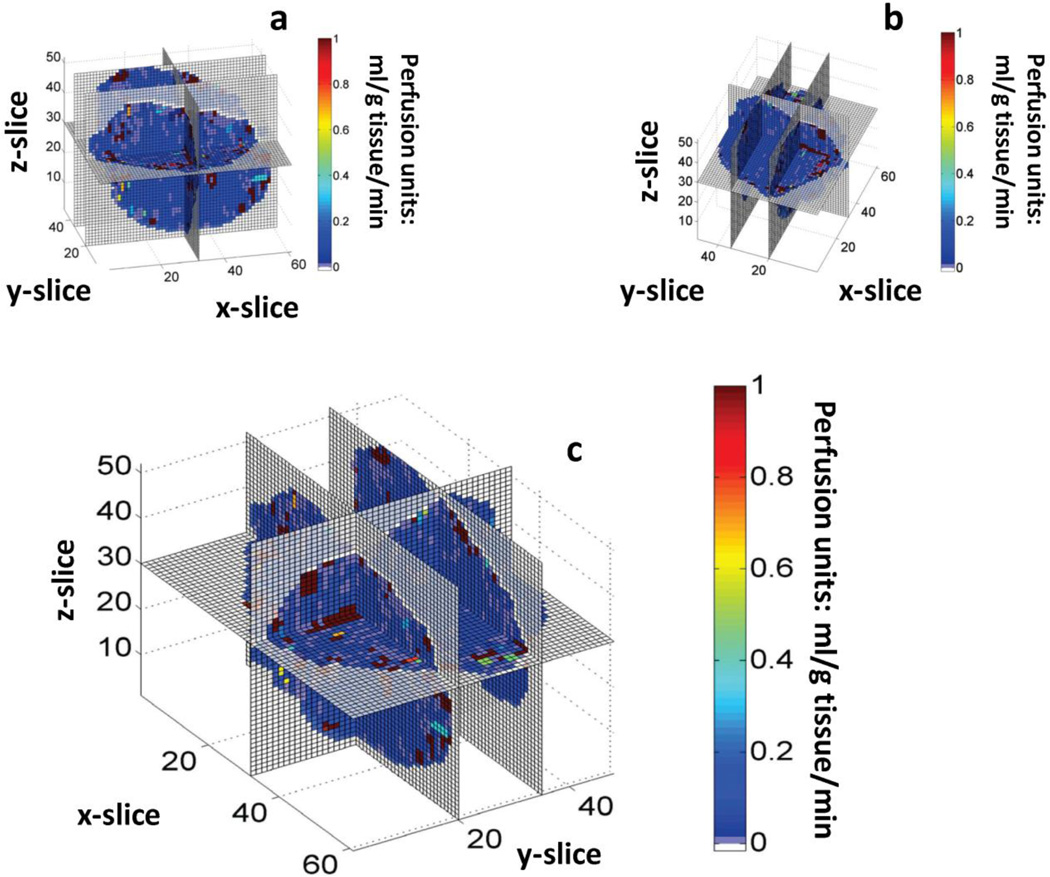
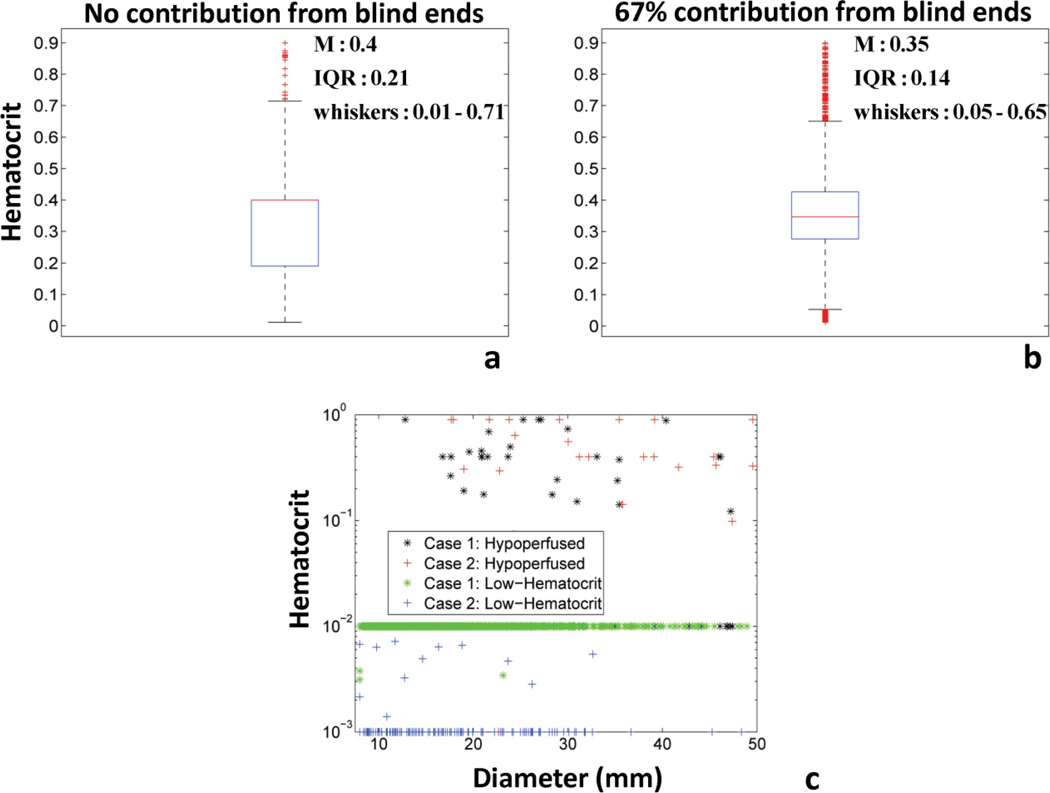
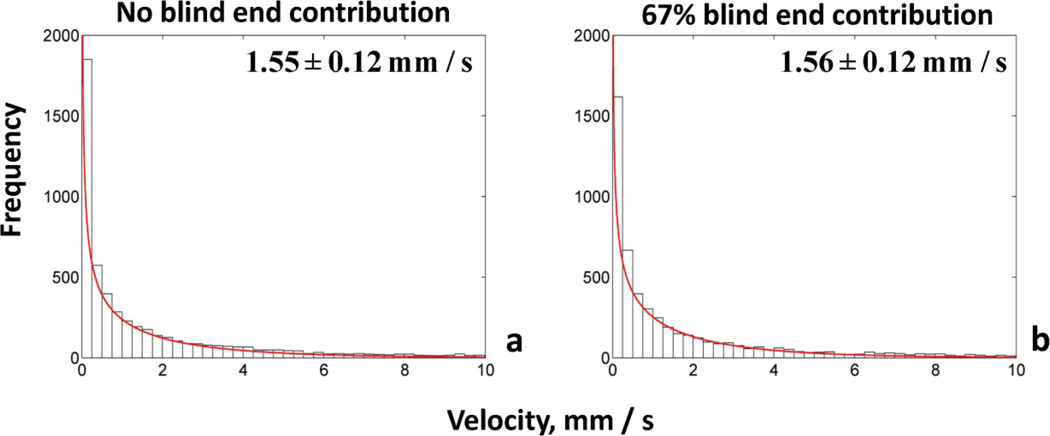
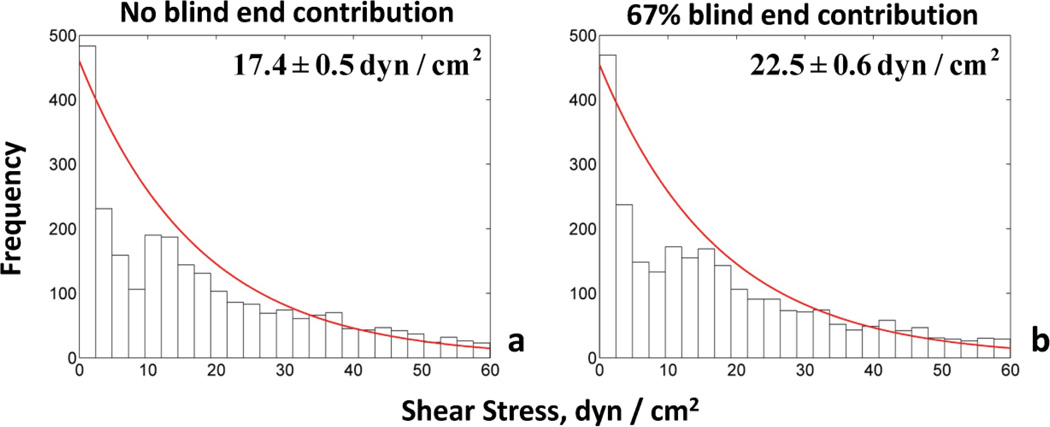
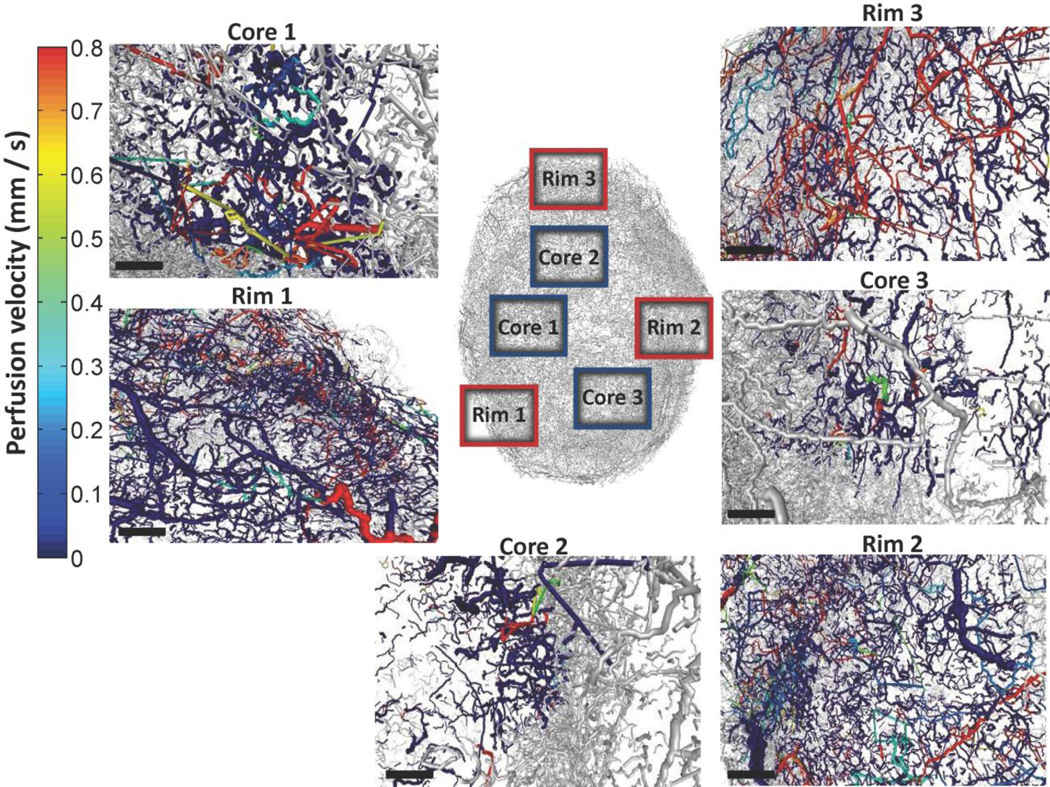
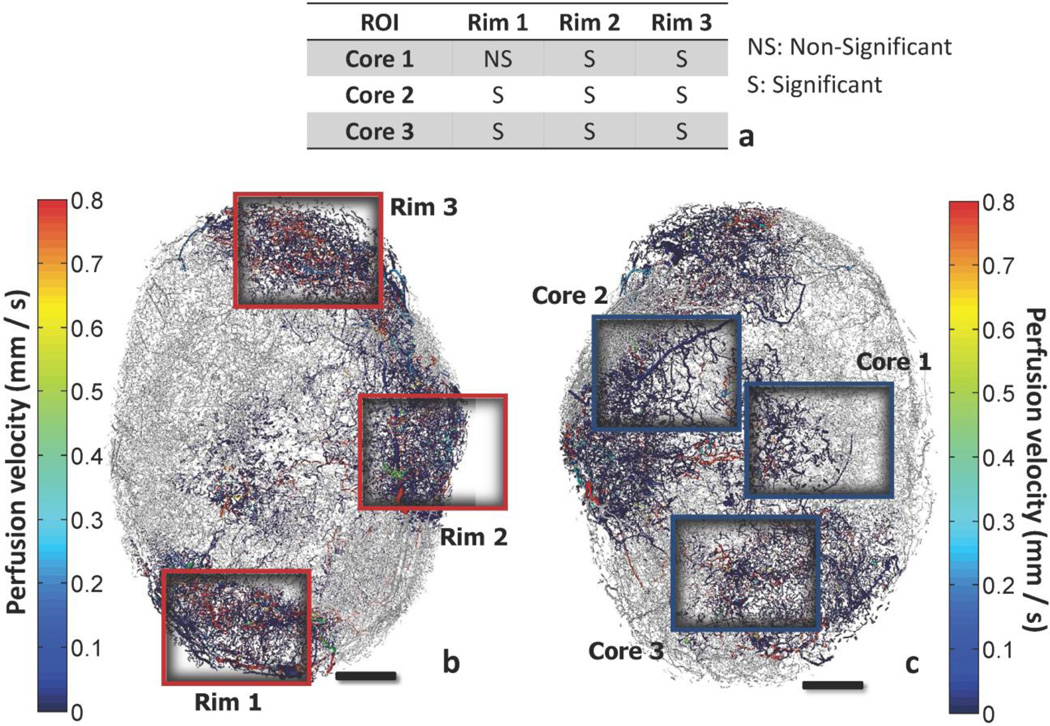
Induction of tumor angiogenesis is among the hallmarks of cancer and a driver of metastatic cascade initiation. Recent advances in high-resolution imaging enable highly detailed three-dimensional geometrical representation of the whole-tumor microvascular architecture. This enormous increase in complexity of image-based data necessitates the application of informatics methods for the analysis, mining and reconstruction of these spatial graph data structures. We present a novel methodology that combines ex-vivo high-resolution micro-computed tomography imaging data with a bioimage informatics algorithm to track and reconstruct the whole-tumor vasculature of a human breast cancer model. The reconstructed tumor vascular network is used as an input of a computational model that estimates blood flow in each segment of the tumor microvascular network. This formulation involves a well-established biophysical model and an optimization algorithm that ensures mass balance and detailed monitoring of all the vessels that feed and drain blood from the tumor microvascular network. Perfusion maps for the whole-tumor microvascular network are computed. Morphological and hemodynamic indices from different regions are compared to infer their role in overall tumor perfusion.

Keywords: Adjacency matrix; BFS; D; DFS; G; IQR; L; L(D); MPL; MTT; Minimum heap; N; P; Priority queue; Q; R; a symmetric matrix consisting of ones and zeros indicating whether or not 2 nodes are connected with a segment; breadth-first search traversal algorithm (systematic visiting of nodes and segments of the graph); data structure where each element is served based on a predefined priority; depth-first search traversal algorithm (systematic visiting of nodes and segments of the graph); flow rate; flow-weighted mean path length; hydraulic conductance; interquartile range (measure of data dispersion); m(tissue); mass of tumor tissue; maximum extravascular diffusion distance of oxygen; pressure; segment diameter; segment length; total mean transit time; total number of segments; tree-based data structure where the parent nodes have always an identity (key) smaller than their children nodes; vascular length density.


Figures

Fig. 1
Fig. 1. 3D micro-CT derived whole-tumor microvasculature from a human triple-negative breast cancer xenograft (MDA-MB-231 cells)
Vessel segmentation results in morphological discrepancies and discontinuities in the vasculature. (a) Raw tumor vascular network. (b), (c) and (d) insets illustrate magnified regions of the raw vascular network. Scale bars: 1 mm (a), 100 µm (b), (c) and (d).
Fig. 2
Fig. 2. Outline of the combined computational-experimental procedure for tumor vasculature characterization
Human breast cancer xenografts are excised and high resolution µCT imaging is performed. Image vessel segmentation yields noisy discontinuous raw vascular structures that require further processing. The 3D tracking and reconstruction algorithm consists of 3 modules. Module 1 implementation involves connection of discontinuous vessels based on geometrical similarities (patterns). The output of Module 1 is a graph involving an ensemble of nodes that are fully connected. Module 2 implementation involves reconstruction of individual segments from these nodes and annotation of them (internal, branching, boundary). Module 3 implementation involves integration of this connected sub-network to the remaining structure through identification of common nodes. The output of the algorithm is the adjacency matrix and the segment morphology vector that uniquely characterize the network connectivity and morphology.
Fig. 3
Fig. 3. Schematic of the iterative process for pressure and hematocrit estimation in the microvascular network
The outputs of bioimage informatics algorithm and an initial assumption for hematocrit and boundary conditions are the inputs to the hemodynamic model. The linear blood flow model provides initial estimates of internal and boundary pressures. The regional perfusion is checked if it is in the experimentally reported range. The mass balance is checked with respect to vessel segments that perfuse or drain blood from the vasculature. If any of these conditions is not satisfied the nonlinear constrained optimization routine adjusts the boundary pressure vector, and the blood flow model is run again with updated boundary conditions. The optimization is based on a compartmental model shown in the inset flowchart, simulating the exchange of blood between the tumor microvasculature and the blood pool compartment. This influx/efflux takes place through boundary segments as the ones presented in the inset image. The nonlinear model provides estimates for hematocrit values across all segments of the vasculature. The process is iterated until convergence. Scale bar: 100 µm.
Fig. 4
Fig. 4. Sequence of output images illustrating the microvascular network reconstructed by the 3D tracking algorithm
(a) Red segments represent the connected backbone sub-network tracked by Modules 1 and 2. (b) Grey segments represent the raw data which were not captured by Modules 1 and 2. (c) Blue segments represent the unconnected segments tracked by Module 3. (d) Red and blue segments are integrated and provide the final structure of the vasculature. Panels scale bar: 1 mm. Insets scale bar: 200 µm.
Fig. 5
Fig. 5. Frequency distributions of tumor vessel segment radii and lengths
(a) Frequency distribution of segment diameters is exponential for the tumor vascular network. (b) Frequency distribution of segment lengths is exponential for the tumor vascular network. The panels present the mean values and the confidence intervals.
Fig. 6
Fig. 6. Whole-tumor perfusion map
(a) Detailed perfusion map of the whole-tumor vascular network color-coded by perfusion velocity (mm/s). (b) and (c) insets illustrate a magnified 3D perspective of different regions of tumor vasculature color-coded by perfusion velocity. Perfusion velocities >1 mm/s are color-coded bright red. Scale bars: 1 mm (a), 200 µm (b) and (c).
Fig. 7
Fig. 7. Discretized 3D whole-tumor perfusion map
Three different perspectives of the 3D perfusion map for the tumor vascular network. A coarse spatial 3D grid has been overlaid to discretize the vascular network and provide an average perfusion estimate in 100×100×100 µm3 voxels. Perfusion units: ml/g tissue/min.
Fig. 8
Fig. 8. Comparison of hematocrit variation and vessel clustering for two case studies of blood flow simulations
(a) Boxplot of hematocrit variation of transport vessels for the Case 1: No blind end contribution to influx/efflux of tumor vascular network. (b) Boxplot of hematocrit variation of transport vessels for the Case 2: 67% of blind end contribution to influx/efflux of tumor vascular network. Red line in the boxplot presents the median value. The bottom and top of the box present the lower and upper quartiles (25th and 75th percentile respectively). The lower and upper whiskers present the 9th and 91st percentile of dispersion. (c) Scatter plot of hematocrit vs. segment diameter for both cases and different vessel sub-types: Hypoperfused (VSTT>25s) and low-hematocrit (HD<0.01).
Fig. 9
Fig. 9. Frequency distributions of flow velocities for two cases of blood flow simulations
The frequency distribution of velocities (mm/s) is gamma function for both cases accounting for different percentage of blind end contribution to influx/efflux of tumor vascular network. (a) No blind ends, (b) 67% blind ends. The panels present the mean values and the confidence intervals.
Fig. 10
Fig. 10. Frequency distributions of shear stress for two cases of blood flow simulations
The frequency distribution of shear stress (dyn/cm2) is exponential for both cases accounting for different percentage of blind end contribution to influx/efflux of tumor vascular network. (a) No blind ends, (b) 67% blind ends. The panels present the mean values and the confidence intervals.
Fig. 11
Fig. 11. Regions of interest (ROI) for morphological and hemodynamic analysis
The regions extracted from the rim and the cores are color-coded by velocity (mm/s), and are broadly comprised of 3 core ROI (Core1-3) and 3 rim ROI (Rim1-3). Scale bars: 400 µm.
Fig. 12
Fig. 12. Comparison of velocity frequency distribution for core and rim regions of interest
The regions which are extracted from the rim and the core of the tumor are presented color-coded by perfusion velocity (mm/s). The probability density distributions of velocities can be described by a gamma function for all regions. (a) Inset table comparing the velocity distributions with the two-sample K-S test. View of the vascular network annotating the position of rim regions (b) and core regions (c). Scale bars: 1 mm.

Similar articles

Cited by

References

    1. Acker JC, et al. Blood perfusion measurements in human tumours: evaluation of laser Doppler methods. Int J Hyperthermia. 1990;6:287–304. - PubMed
    1. Baish JW, et al. Scaling rules for diffusive drug delivery in tumor and normal tissues. Proc Natl Acad Sci U S A. 2011;108:1799–1803. - PMC - PubMed
    1. Beaney RP, et al. Positron emission tomography for in-vivo measurement of regional blood flow, oxygen utilisation, and blood volume in patients with breast carcinoma. Lancet. 1984;1:131–134. - PubMed
    1. Benedict KF, et al. Hemodynamic systems analysis of capillary network remodeling during the progression of type 2 diabetes. Microcirculation. 2011;18:63–73. - PubMed
    1. Bentley MD, et al. The use of microcomputed tomography to study microvasculature in small rodents. Am J Physiol Regul Integr Comp Physiol. 2002;282:R1267–R1279. - PubMed

Publication types

Substances