. 2014;58(3):1348-58.
doi: 10.1128/AAC.01858-13. Epub 2013 Dec 16.

Antibiotic activity against naive and induced Streptococcus pneumoniae biofilms in an in vitro pharmacodynamic model

Affiliations

Antibiotic activity against naive and induced Streptococcus pneumoniae biofilms in an in vitro pharmacodynamic model

Nathalie M Vandevelde et al. Antimicrob Agents Chemother. 2014.

Abstract

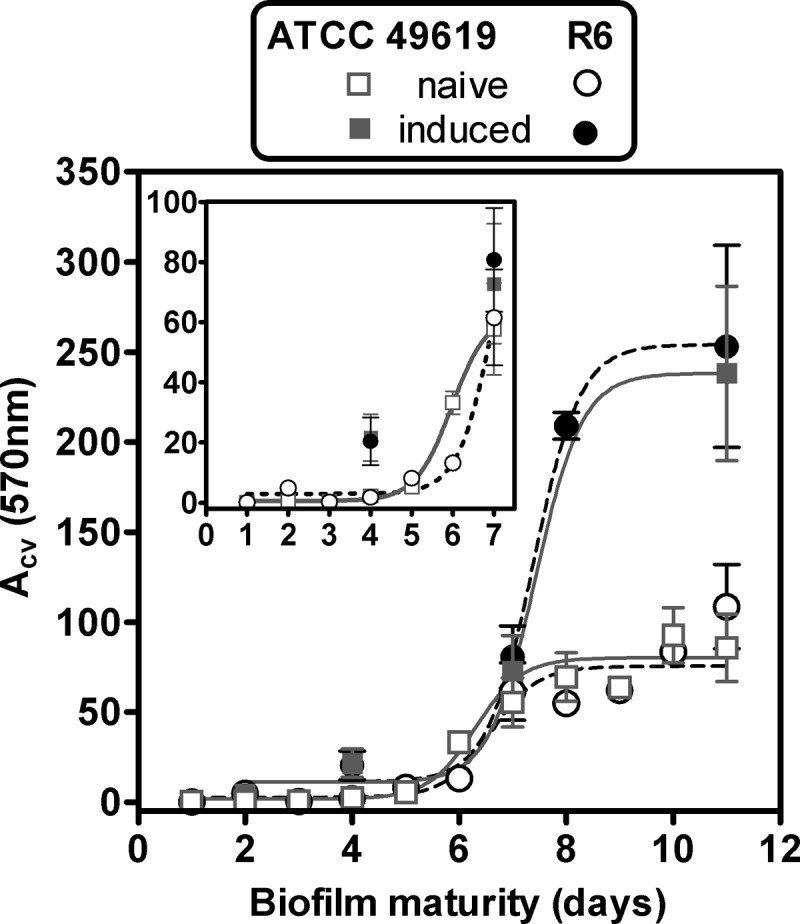
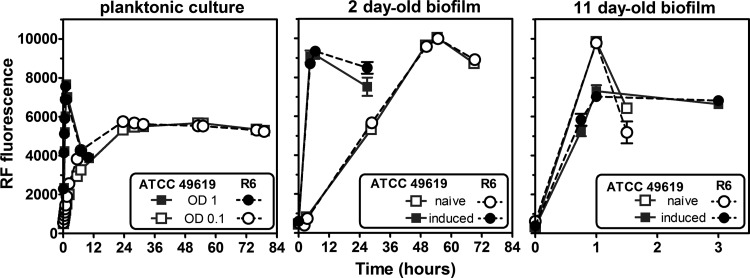
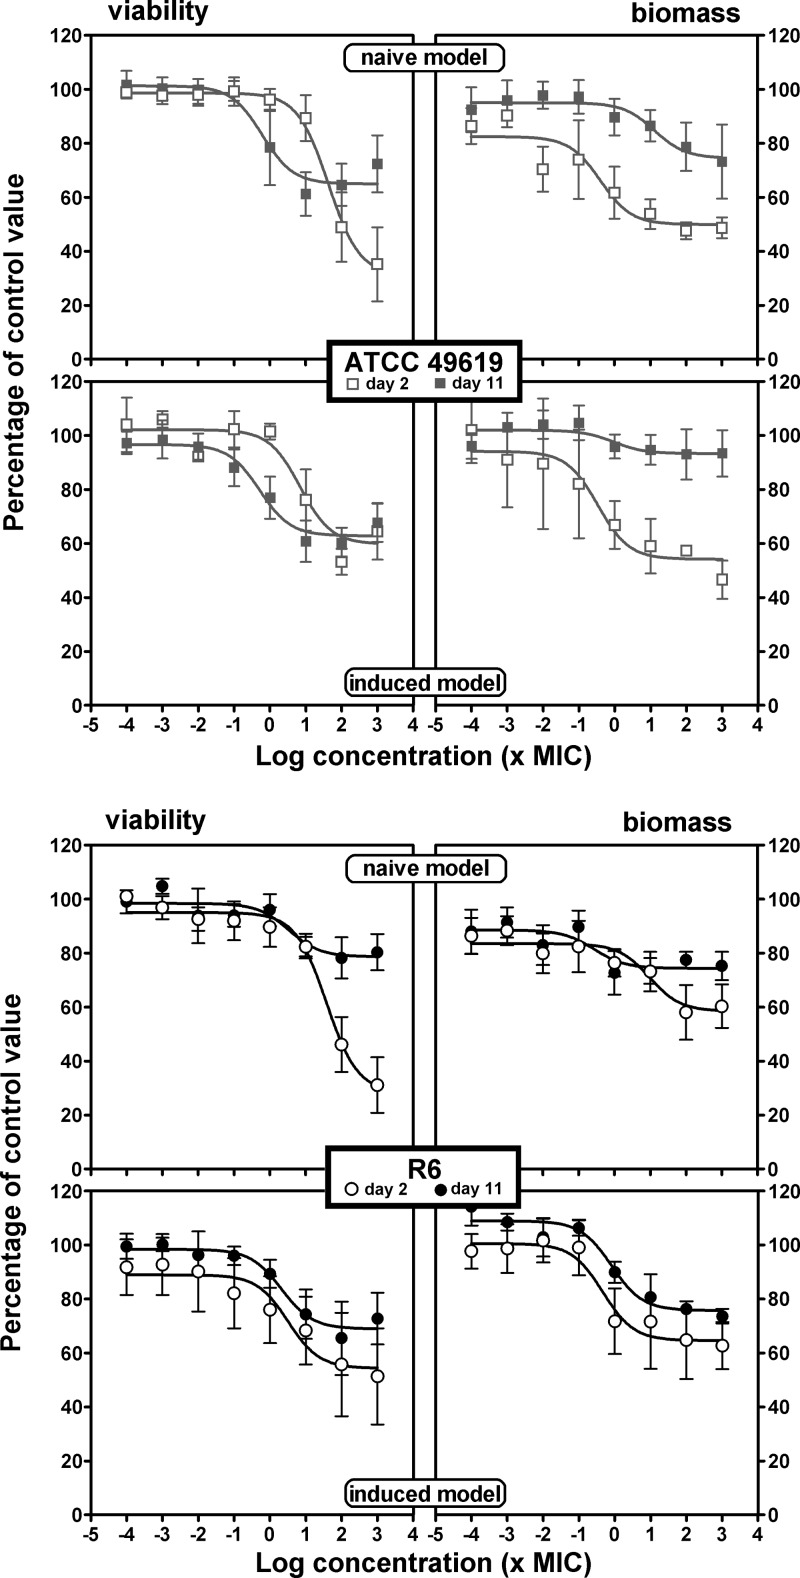
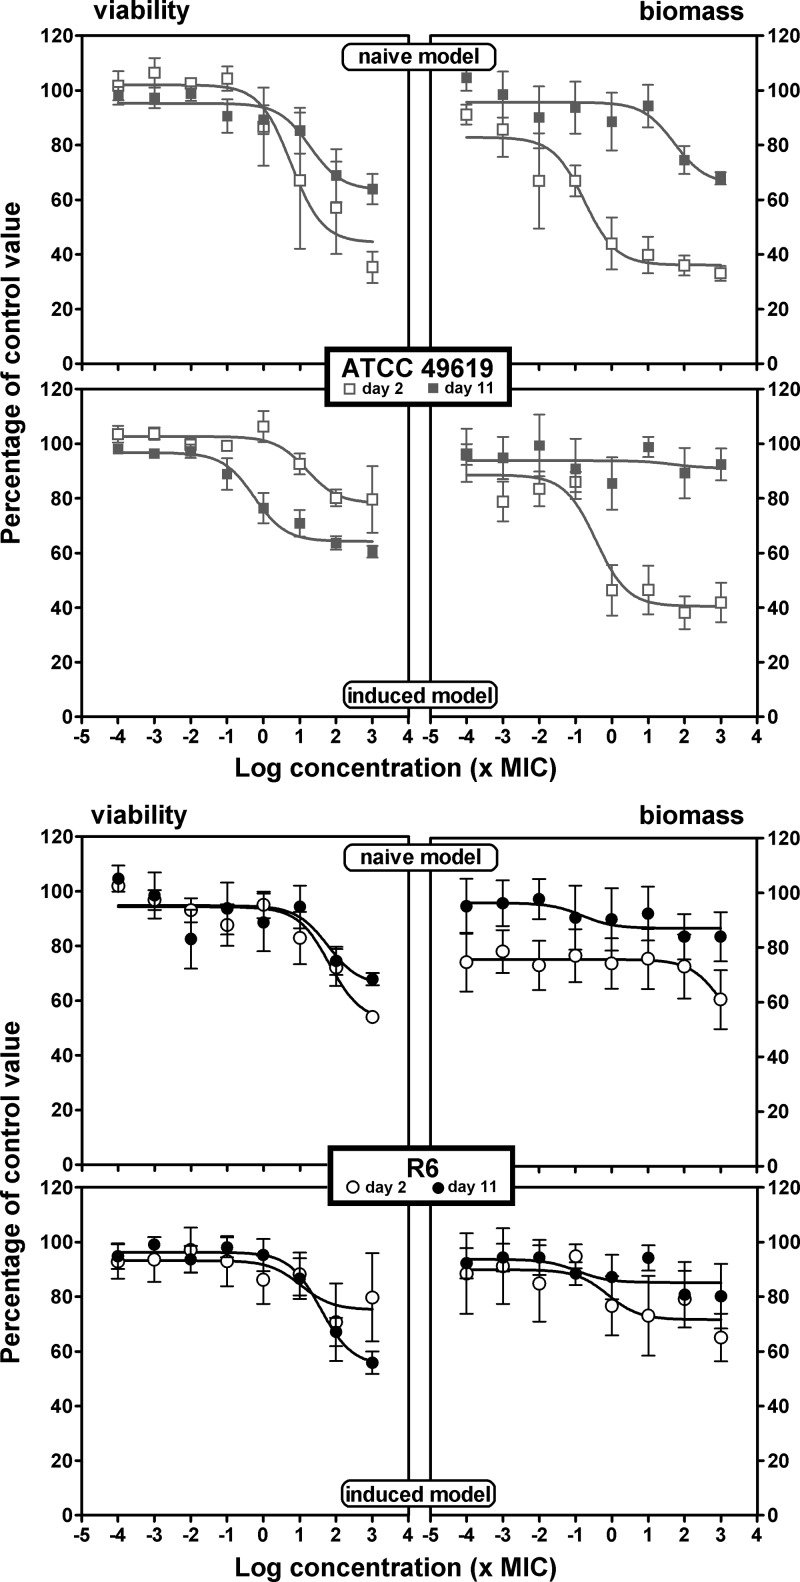
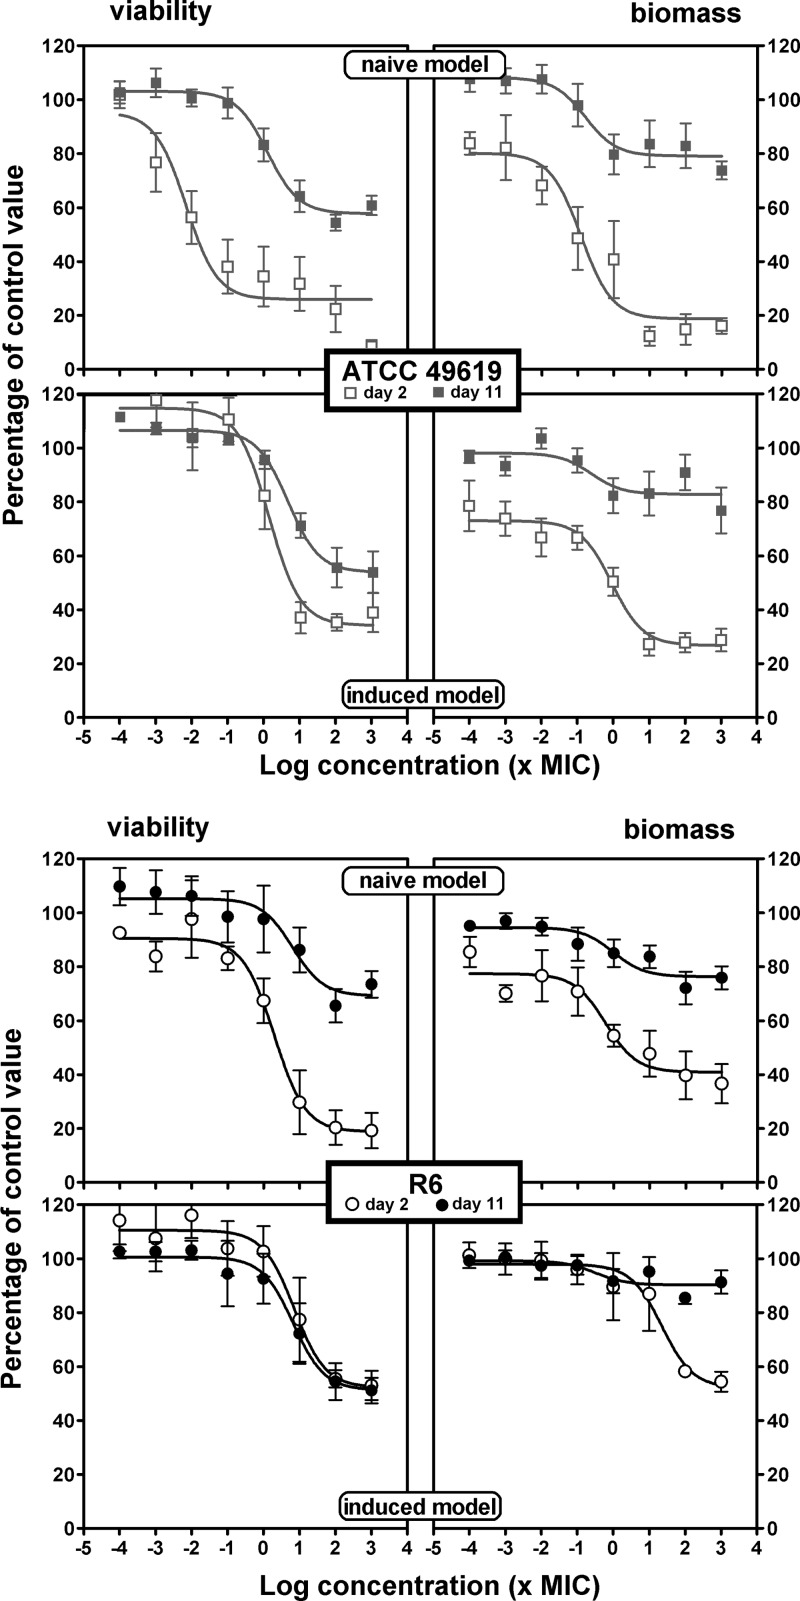
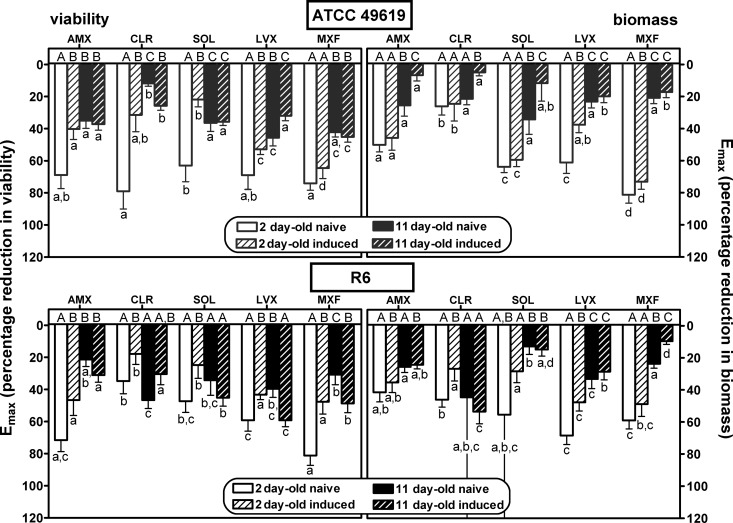
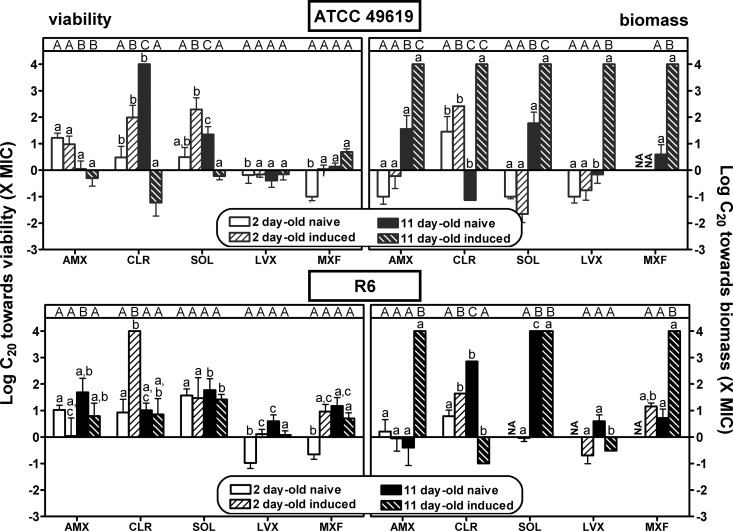
Biofilms play a role in the pathogenicity of pneumococcal infections. A pharmacodynamic in vitro model of biofilm was developed that allows characterization of the activity of antibiotics against viability and biomass by using in parallel capsulated (ATCC 49619) and noncapsulated (R6) reference strains. Naive biofilms were obtained by incubating fresh planktonic cultures for 2 to 11 days in 96-well polystyrene plates. Induced biofilms were obtained using planktonic bacteria collected from the supernatant of 6-day-old naive biofilms. Biomass production was more rapid and intense in the induced model, but the levels were similar for both strains. Full concentration responses fitting sigmoidal regressions allowed calculation of maximal efficacies and relative potencies of drugs. All antibiotics tested (amoxicillin, clarithromycin, solithromycin, levofloxacin, and moxifloxacin) were more effective against young naive biofilms than against old or induced biofilms, except macrolides/ketolides, which were as effective at reducing viability in 2-day-old naive biofilms and in 11-day-old induced biofilms of R6. Macrolides/ketolides, however, were less potent than fluoroquinolones against R6 (approximately 5- to 20-fold-higher concentrations needed to reduction viability of 20%). However, at concentrations obtainable in epithelial lining fluid, the viabilities of mature or induced biofilms were reduced 15 to 45% (amoxicillin), 17 to 44% (macrolides/ketolides), and 12 to 64% (fluoroquinolones), and biomasses were reduced 5 to 45% (amoxicillin), 5 to 60% (macrolides/ketolides), and 10 to 76% (fluoroquinolones), with solithromycin and moxifloxacin being the most effective and the most potent agents (due to lower MICs) in their respective classes. This study allowed the ranking of antibiotics with respect to their potential effectiveness in biofilm-related infections, underlining the need to search for still more effective options.


Figures

FIG 1
FIG 1
Evolution over time of matrix production (as evaluated by crystal violet [CV] absorbance) by the capsulated strain ATCC 49619 (gray squares) and the noncapsulated strain R6 (black circles) in the naive model (dotted lines, open symbols) and the induced model (solid lines, closed symbols). The inset shows the same data at higher scale for the first 7 days of incubation. All values are means ± standard deviations (SD) of 8 to 28 independent determinations. When not visible, the SD bars are smaller than the size of the symbols.
FIG 2
FIG 2
Evolution of resorufin (RF) fluorescence overtime with the capsulated strain ATCC 49619 (gray squares) and the noncapsulated strain R6 (black circles) in planktonic cultures (left panel) using starting inocula at an OD620 of 0.1 (open symbols) or 1 (closed symbols) or in biofilms (middle and right panels) at different maturity stages (2- and 11-day-old naive [open symbols] and induced [closed symbols] models). All values are means ± standard deviations (SD) of 3 independent determinations. When not visible, the SD bars are smaller than the size of the symbols.
FIG 3
FIG 3
Concentration-response activity of amoxicillin against biofilms of ATCC 49619 (top) or R6 (bottom). Two-day-old (open symbols) or 11-day-old (closed symbols) biofilms from the naive model (upper panels for each strain) or the induced model (lower panels for each strain) were incubated with increasing concentrations of antibiotics for 24 h. The ordinate shows the change in viability (measured by the decrease in resorufin fluorescence [left panels]) or in biofilm mass (measured by the decrease in crystal violet absorbance [right panels]) as a percentage of the control value (no antibiotic present). All values are means ± SEM of 4 to 10 independent experiments performed in quadruplicate. When not visible, the error bars are smaller than the size of the symbols. The pertinent pharmacological descriptors of the curves are presented in Tables S1 and S2 in the supplemental material.
FIG 4
FIG 4
Concentration-response activity of solithromycin against biofilms of ATCC 49619 (top) or R6 (bottom). Two-day-old (open symbols) or 11-day-old (closed symbols) biofilms from the naive model (upper panels for each strain) or the induced model (lower panels for each strain) were incubated with increasing concentrations of solithromycin for 24 h. The ordinate shows the change in viability (measured by the decrease in resorufin fluorescence [left panels]) or in biofilm mass (measured by the decrease in crystal violet absorbance [right panels]) as a percentage of the control value (no antibiotic present). All values are means ± SEM of 4 to 10 independent experiments performed in quadruplicate. When not visible, the error bars are smaller than the size of the symbols. The pertinent pharmacological descriptors of the curves are presented in Tables S1 and S2 in the supplemental material.
FIG 5
FIG 5
Concentration-response activity of moxifloxacin against biofilms of ATCC 49619 (top) or R6 (bottom). Two-day-old (open symbols) or 11-day-old (closed symbols) biofilms from the naive model (upper panels for each strain) or the induced model (lower panels for each strain) were incubated with increasing concentrations of moxifloxacin for 24 h. The ordinate shows the change in viability (measured by the decrease in resorufin fluorescence [left panels]) or in biofilm mass (measured by the decrease in crystal violet absorbance [right panels]) as a percentage of the control value (no antibiotic present). All values are means ± SEM of 4 to 10 independent experiments performed in quadruplicate. When not visible, the error bars are smaller than the size of the symbols. The pertinent pharmacological descriptors of the curves are presented in Tables S1 and S2 in the supplemental material.
FIG 6
FIG 6
Comparison of antibiotic maximal efficacies (Emax) expressed as percentages of reduction in viability (left panels) or biomass (right panels) compared to that in the control (no antibiotic) for 2- and 11-day-old naive and induced biofilms of strain ATCC 49619 (upper panels [gray bars]) or R6 (lower panels [black bars]). AMX, amoxicillin; CLR, clarithromycin; SOL, solithromycin; LVX, levofloxacin; MXF, moxifloxacin. Values were calculated as means ± SEM using the Hill equation of the concentration-response curves presented in Fig. 3 to 5 and Fig. S1 and S2 in the supplemental material. (Also see Tables S1 and S2 in the supplemental material for numerical values.) Statistical analyses were performed by one-way analysis of variance (ANOVA) with Tukey's posttest for multiple comparisons; values with different letters are significantly different from each other (P < 0.05). Lowercase letters indicate comparison between antibiotics for each type of biofilm, and capital letters indicate comparison between different types of biofilms for each antibiotic.
FIG 7
FIG 7
Comparison of antibiotic relative potencies (C20) expressed in multiples of the MIC with respect to viability (left panels) or biomass (right panels) for 2- and 11-day-old naive and induced biofilms of strain ATCC 49619 (upper panels [gray bars]) or R6 (lower panels [black bars]). AMX, amoxicillin; CLR, clarithromycin; SOL, solithromycin; LVX, levofloxacin; MXF, moxifloxacin. Values were calculated as means ± SEM (calculated from the 95% confidence interval band around the curve) using the Hill equation of the concentration-response curves presented in Fig. 3 to 5 and Fig. S1 and S2 in the supplemental material. (Also see Tables S1 and S2 in the supplemental material for numerical values.) Statistical analyses were performed by one-way ANOVA with Tukey's posttest for multiple comparisons; values with different letters are significantly different from each other (P < 0.05). Lowercase letters indicate comparison between antibiotics for each type of biofilm, and capital letters indicate comparison between different types of biofilms for each antibiotic. NA, not applicable (a “Top” value of the Hill equation of <80%). When not reached at the maximal value tested, C20 values were set at 4 (log scale).

References

    1. Donlan RM, Costerton JW. 2002. Biofilms: survival mechanisms of clinically relevant microorganisms. Clin. Microbiol. Rev. 15:167–193. 10.1128/CMR.15.2.167-193.2002 - DOI - PMC - PubMed
    1. Moscoso M, Garcia E, Lopez R. 2009. Pneumococcal biofilms. Int. Microbiol. 12:77–85. 10.2436/20.1501.01.84 - DOI - PubMed
    1. Costerton JW, Stewart PS, Greenberg EP. 1999. Bacterial biofilms: a common cause of persistent infections. Science 284:1318–1322. 10.1126/science.284.5418.1318 - DOI - PubMed
    1. Hall-Stoodley L, Stoodley P. 2009. Evolving concepts in biofilm infections. Cell. Microbiol. 11:1034–1043. 10.1111/j.1462-5822.2009.01323.x - DOI - PubMed
    1. Lopez D, Vlamakis H, Kolter R. 2010. Biofilms. Cold Spring Harb. Perspect. Biol. 2:a000398. 10.1101/cshperspect.a000398 - DOI - PMC - PubMed

Publication types

LinkOut - more resources