. 2014 Feb 21;289(8):5158-67.
doi: 10.1074/jbc.M113.511204. Epub 2013 Dec 16.

The hypertrophic cardiomyopathy myosin mutation R453C alters ATP binding and hydrolysis of human cardiac β-myosin

Affiliations

The hypertrophic cardiomyopathy myosin mutation R453C alters ATP binding and hydrolysis of human cardiac β-myosin

Marieke Bloemink et al. J Biol Chem. .

Abstract

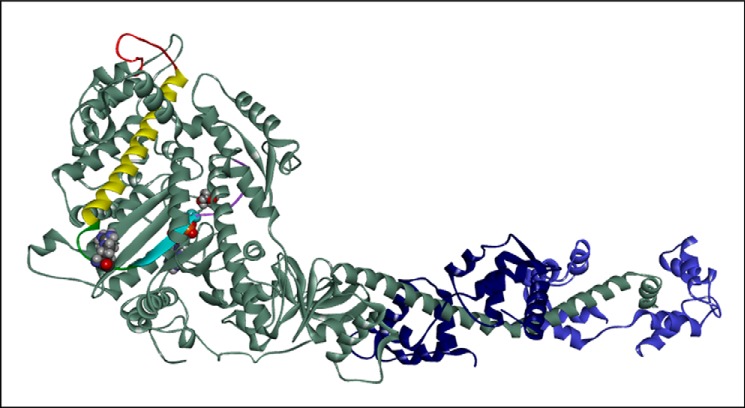
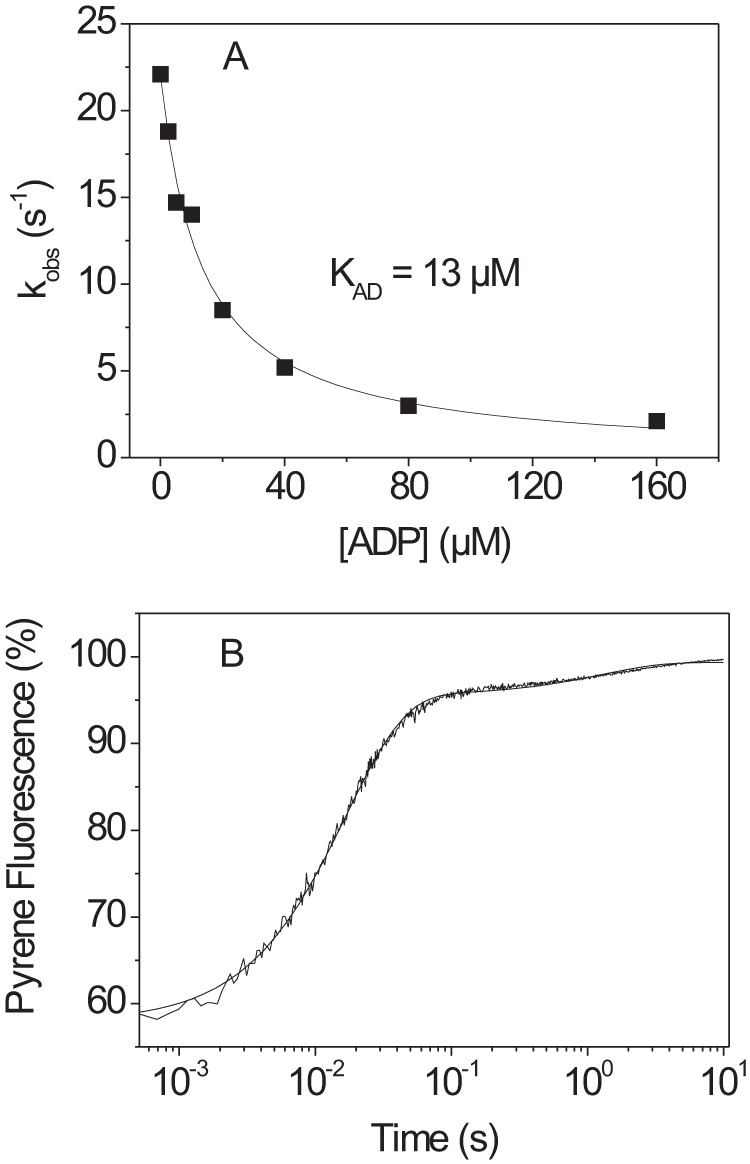
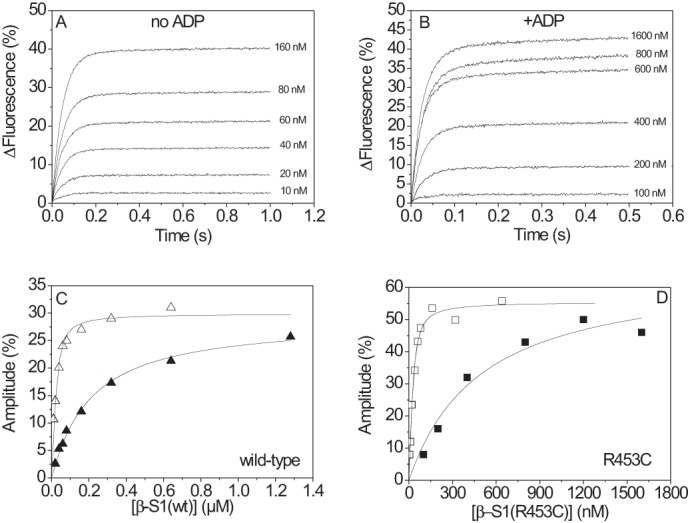
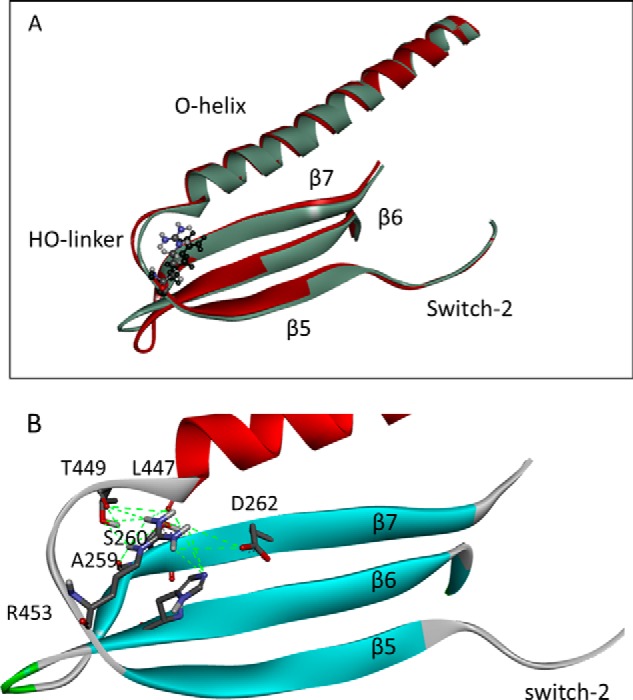
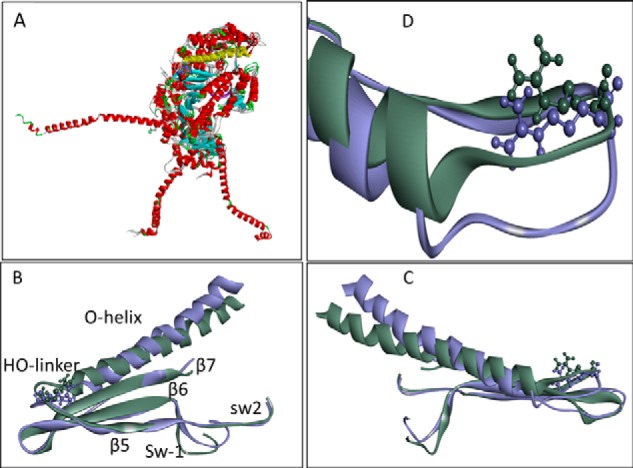
The human hypertrophic cardiomyopathy mutation R453C results in one of the more severe forms of the myopathy. Arg-453 is found in a conserved surface loop of the upper 50-kDa domain of the myosin motor domain and lies between the nucleotide binding pocket and the actin binding site. It connects to the cardiomyopathy loop via a long α-helix, helix O, and to Switch-2 via the fifth strand of the central β-sheet. The mutation is, therefore, in a position to perturb a wide range of myosin molecular activities. We report here the first detailed biochemical kinetic analysis of the motor domain of the human β-cardiac myosin carrying the R453C mutation. A recent report of the same mutation (Sommese, R. F., Sung, J., Nag, S., Sutton, S., Deacon, J. C., Choe, E., Leinwand, L. A., Ruppel, K., and Spudich, J. A. (2013) Proc. Natl. Acad. Sci. U.S.A. 110, 12607-12612) found reduced ATPase and in vitro motility but increased force production using an optical trap. Surprisingly, our results show that the mutation alters few biochemical kinetic parameters significantly. The exceptions are the rate constants for ATP binding to the motor domain (reduced by 35%) and the ATP hydrolysis step/recovery stroke (slowed 3-fold), which could be the rate-limiting step for the ATPase cycle. Effects of the mutation on the recovery stroke are consistent with a perturbation of Switch-2 closure, which is required for the recovery stroke and the subsequent ATP hydrolysis.

Keywords: Actin; Cardiac Muscle; Cardiomyopathy; Fluorescence; Homology Models; Kinetics; Myosin; Protein Structure-Function; Sequence Alignment.


Figures

FIGURE 1.
FIGURE 1.
Overview of cardiac myosin S1 head domain. The S1 is shown with the essential and regulatory light chains (ELC and RLC) in blue. The location of HCM residue Arg-453 (space-filling model), the cardiomyopathy loop (red), and the long O-helix linking them (yellow) is indicated. Residue 453 is on the HO-linker (green) between the O-helix (yellow) and the central β5-sheet (cyan) + SW2 (purple). The location of the nucleotide is also shown as a space-filling model, close to SW2. The cardiac homology model was built using PDB code 1KK8 as a template (detached conformation, SW1 closed, SW2 open, melted SH1 helix).
SCHEME 1.
SCHEME 1.
The interaction of S1 with ATP and ADP. S1, ATP, and ADP are represented as M, T, and D, respectively. * indicates the different levels of tryptophan fluorescence and represents different conformational states of the myosin (27).
SCHEME 2.
SCHEME 2.
The interaction of S1 with actin, ATP, and ADP. T and D represent ATP and ADP, and actin·S1 exists in two conformations, A·M and A·M′, in equilibrium. A·M′ is unable to bind nucleotide and must isomerize to A·M before ATP can bind. A similar pair of conformations exist in the presence of bound ADP, where A·M′·D must isomerize to A·M·D before ADP can dissociate. Cross-bridge detachment from the rigor state (A·M) involves the complex binding ATP, governed by the association constant, K′1, followed by the rate-limiting isomerization, k′+2, after which actin-myosin affinity becomes weak, and the complex separates rapidly (28, 34).
FIGURE 2.
FIGURE 2.
ATP-binding to β-S1R453C. A, 0.2 μm β-S1R453C was rapidly mixed with 250 μm ATP using stopped-flow. The resulting change in tryptophan fluorescence could be best fitted using a double exponential from which the resulting kobs was determined with kobs = 69 s−1 for the fast phase (amplitude= 17%) and 1.3 s−1 for the slow phase (amplitude= 1%). rel.W, relative Trp. B, dependence of the fast phase kobs on ATP concentration for β-S1R453C (■) and β-S1WT (□) and their respective slow phases (●, ○). At high ATP-concentrations, kobs (=k+2) saturate at 88 ± 3 s−1 for β-S1R453C and at 137 ± 7 s−1 for β-S1 WT. From the hyperbolic fit, K1k+2 can be determined: K1k+2 = 1.08 ± 0.07 μm−1s−1 for β-S1R453C and 1.5 ± 0.07 μm−1s−1 for β-S1 WT. At high ATP the observed slow rates (k+3 + k−3) saturate at 14 s−1 for β-S1 WT (○) and at 3–4 s−1 for β-S1R453C (●). Note that the amplitudes of the observed reaction were independent of ATP concentration (fast phase 17 ± 1.5%, slow phase 1.2 ± 0.3%).
FIGURE 3.
FIGURE 3.
ATP-induced dissociation of actin·β-S1R453C. A, pyrene fluorescence trace observed upon rapidly mixing 0.05 μm pyrene-labeled actin·S1 with 250 μm ATP at 20 °C. The best fit was a double exponential with a fast phase (kobs = 265 s−1, amplitude= 29%) and a slow phase (kobs = 34 s−1, amplitude= 4.7%). B, dependence of kobs on ATP concentration at 20 °C. At high ATP concentrations, kobs saturates at 1357 ± 78 s−1 for the fast phase (■) and at 85 ± 20 s−1 for the slow phase (●).
FIGURE 4.
FIGURE 4.
ATP-induced dissociation of actin·β-S1R453C in the presence of ADP. A, 100 nm pyrene-labeled actin was incubated with an equimolar amount of β-S1R453C before mixing with 20 μm ATP and variable ADP concentrations (20 °C). The data were fitted using a single exponential, resulting in an apparent affinity (KAD) for ADP (KAD = 13 ± 1 μm). B, pyrene fluorescence trace measured for 100 nm actin·β-S1R453C incubated with 100/50 μm ADP before mixing with 2 mm MgATP. The data are best fitted using a double exponential with kfast = 60.4 s−1 (amplitude= 38%) and kslow = 0.78 s−1 (amplitude= 4%).
FIGURE 5.
FIGURE 5.
Titration of actin with actin·β-S1R453C. 30 nm phalloidin-stabilized actin was incubated with various amounts of β-S1R453C before mixing with 20 μm ATP without ADP present (□) (A) or with 500 μm ATP in the presence of 100 μm ADP (■) (B). The fluorescence was fitted using a single exponential, and the amplitude increased with increasing S1 concentration. C and D, the best fit of the amplitude dependence on S1 concentration was determined using the quadratic equation describing the binding isotherm (see “Experimental Procedures”). This resulted in KA = 8 nm (▵) and KDA = 190 nm (▴) for β-S1 WT (panel C) and in KA = 11 nm (□) and KDA = 472 nm (■) for β-S1R453C (panel D).
FIGURE 6.
FIGURE 6.
Details of the HO-linker in scallop and cardiac myosin. A, overlay of the crystal structures of cardiac myosin (PDB code 4DB1) and scallop (PDB code 1KK8) showing the O-helix, HO-linker, and β5, β6, and β7 of the central β-sheet. The cardiac structure is in red, the scallop structure is in gray, and the cardiomyopathy residue Arg-453 is shown as a ball and stick model. B, detail of the interactions of the Arg-453 side chain in a homology model of human cardiac myosin built using the scallop PDB 1QVI structure as template. A full list of the contacts between Arg-453 and the other elements is given in Table 2.
FIGURE 7.
FIGURE 7.
Overlay of scallop crystal structures. A, overlay of five Scallop crystal structures showing major reorientation of the converter and lever arm in the different myosin conformations. The changes in the 50-kDa domain are more subtle (red ribbons represent α-helices, cyan arrows are β-sheets. Note that the long O-helix (yellow) and central β-sheet (cyan) show only small movements. The Arg-453 area is shown in more detail in B–D. B–D, close-up showing the HO-linker movement between the rigor (PDB code 2OS8, purple) and post-rigor (PDB code 2OTG, gray) structures. The change from the rigor into the post-rigor conformation shows the biggest difference in the HO-linker conformation. The change involves closing of switch 1 and a twisting/bending of the O-helix. The orientation of B and C is 180° rotated. D, detail of the movement of the HO-linker. A list of the Arg-453 contacts in these structures is given in Table 2. Note that β6-β7 have been removed in D for clarity.

References

    1. Liew C. C., Dzau V. J. (2004) Molecular genetics and genomics of heart failure. Nat. Rev. Genet. 5, 811–825 - PubMed
    1. Marian A. J., Roberts R. (1994) Molecular basis of hypertrophic and dilated cardiomyopathy. Tex. Heart Inst. J. 21, 6–15 - PMC - PubMed
    1. Ramaraj R. (2008) Hypertrophic cardiomyopathy. Etiology, diagnosis, and treatment. Cardiol. Rev. 16, 172–180 - PubMed
    1. Koester M. C. (2001) A review of sudden cardiac death in young athletes and strategies for preparticipation cardiovascular screening. J. Athl. Train. 36, 197–204 - PMC - PubMed
    1. Maron B. J. (2002) Hypertrophic cardiomyopathy. Circulation 106, 2419–2421 - PubMed

Publication types

LinkOut - more resources