. 2013 Dec 23;203(6):957-69.
doi: 10.1083/jcb.201306054.

KNL1 facilitates phosphorylation of outer kinetochore proteins by promoting Aurora B kinase activity

KNL1 facilitates phosphorylation of outer kinetochore proteins by promoting Aurora B kinase activity

Gina V Caldas et al. J Cell Biol. .

Abstract

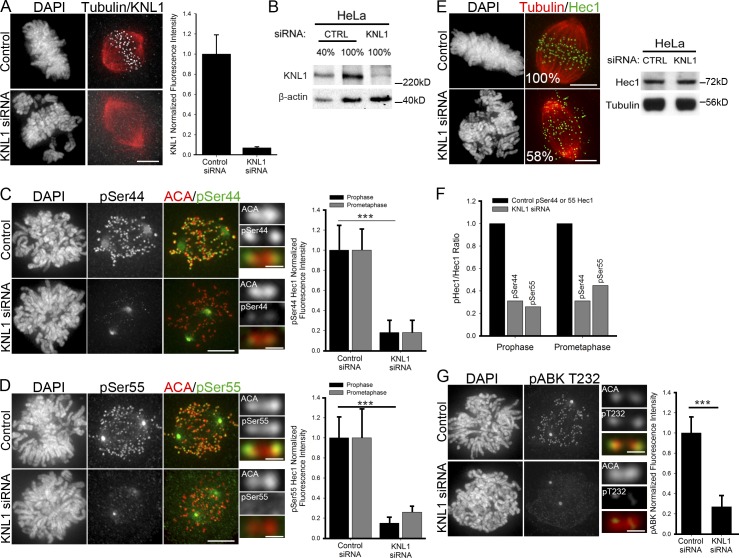
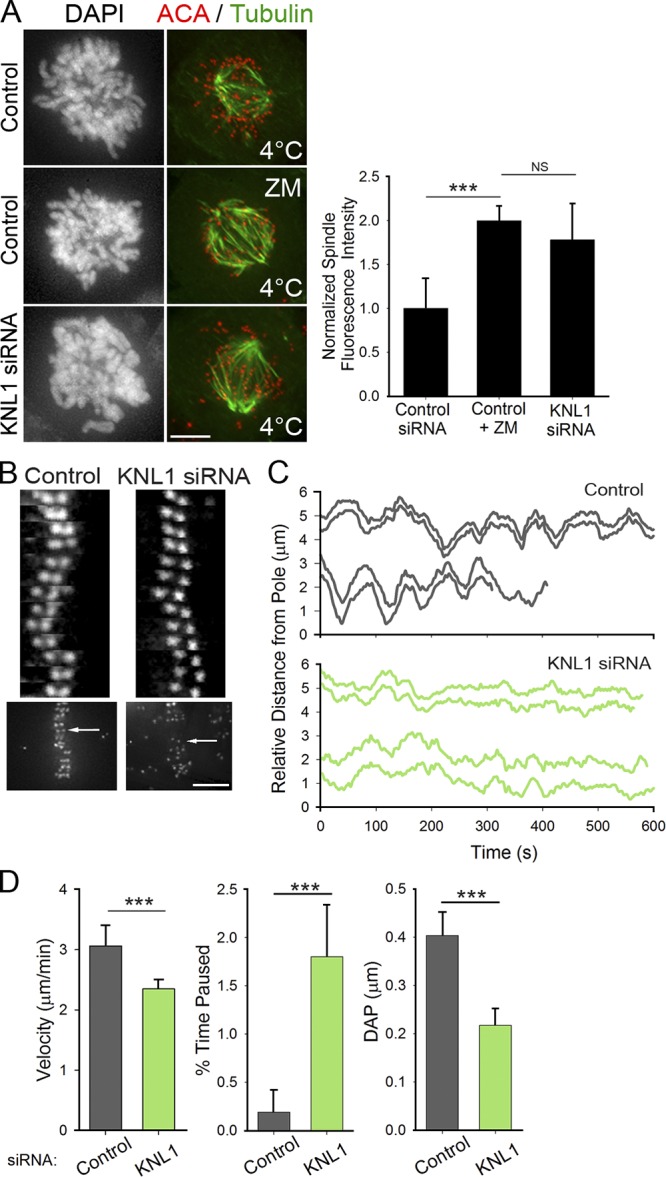
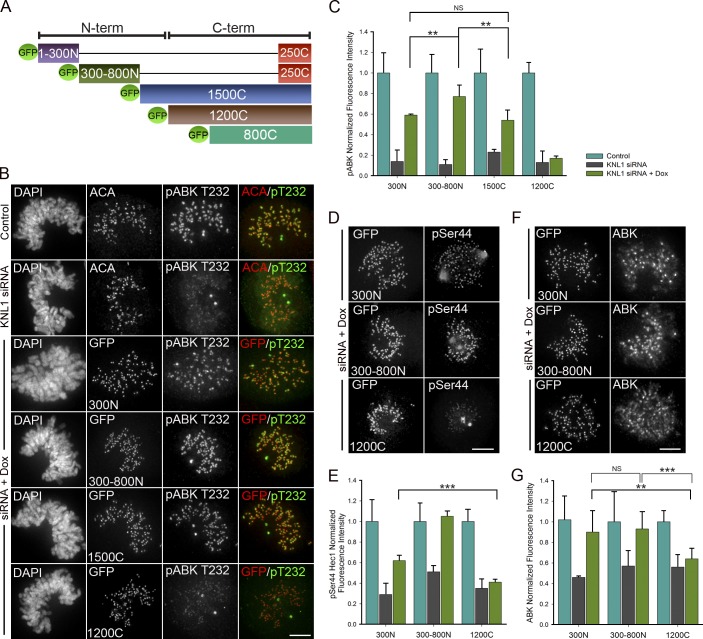
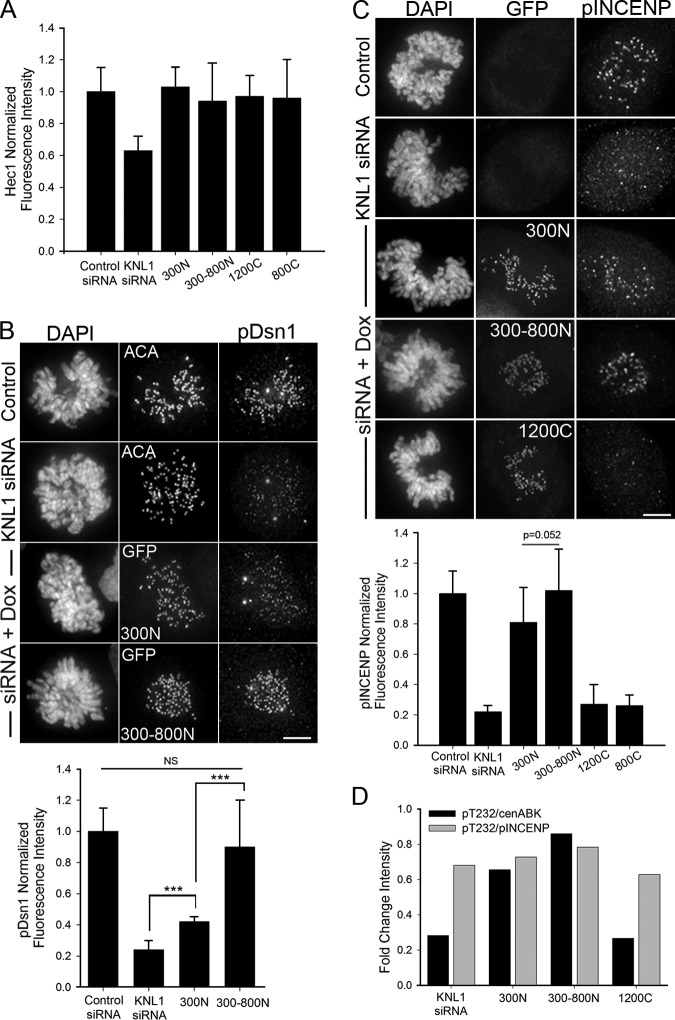
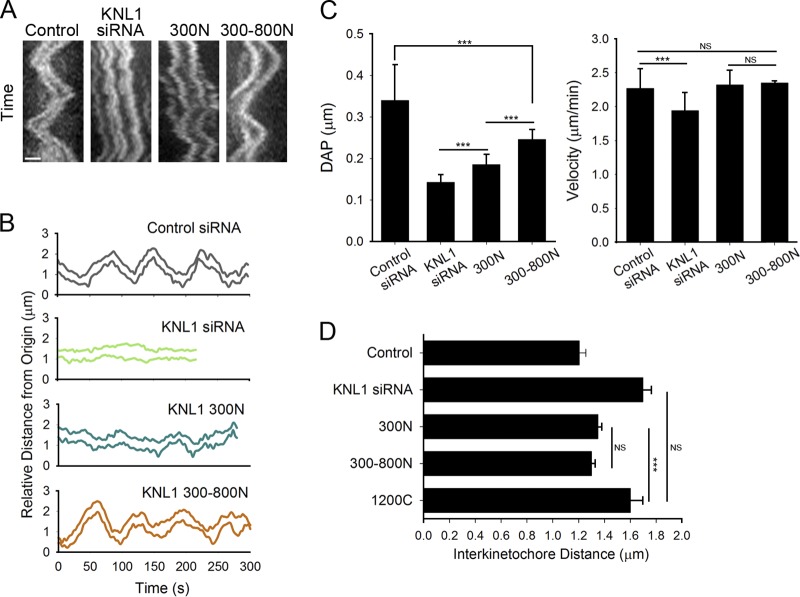
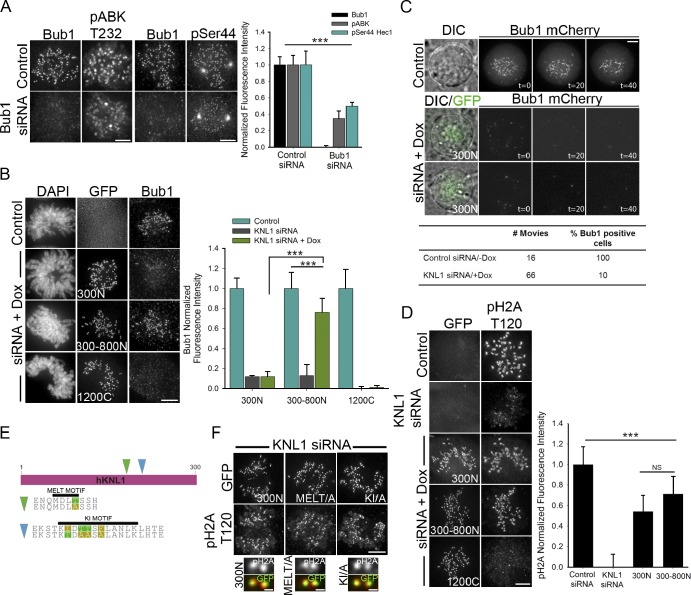
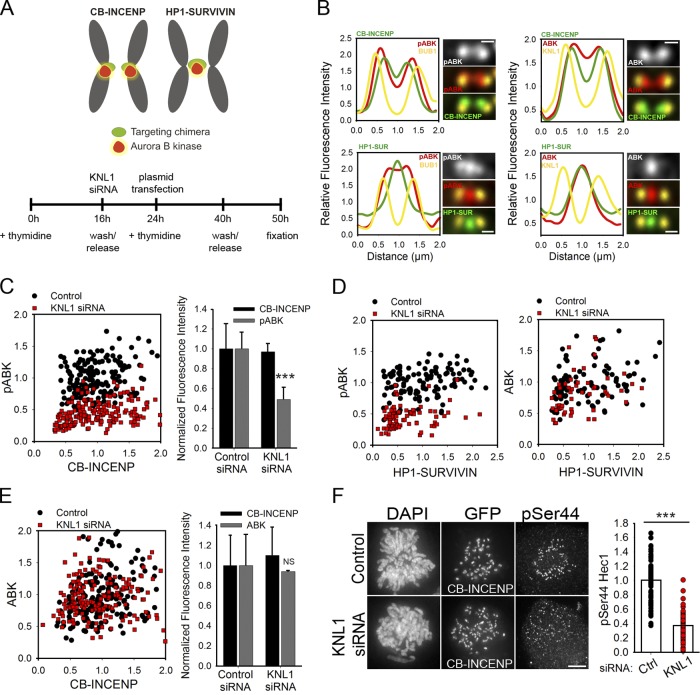
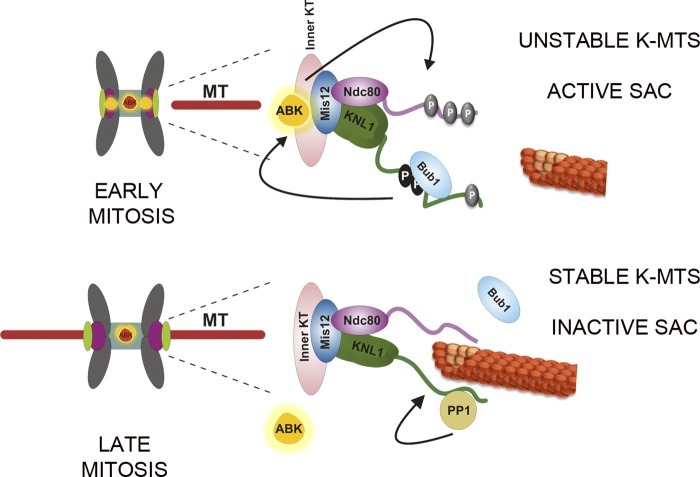
Aurora B kinase phosphorylates kinetochore proteins during early mitosis, increasing kinetochore–microtubule (MT) turnover and preventing premature stabilization of kinetochore–MT attachments. Phosphorylation of kinetochore proteins during late mitosis is low, promoting attachment stabilization, which is required for anaphase onset. The kinetochore protein KNL1 recruits Aurora B–counteracting phosphatases and the Aurora B–targeting factor Bub1, yet the consequences of KNL1 depletion on Aurora B phospho-regulation remain unknown. Here, we demonstrate that the KNL1 N terminus is essential for Aurora B activity at kinetochores. This region of KNL1 is also required for Bub1 kinase activity at kinetochores, suggesting that KNL1 promotes Aurora B activity through Bub1-mediated Aurora B targeting. However, ectopic targeting of Aurora B to kinetochores does not fully rescue Aurora B activity in KNL1-depleted cells, suggesting KNL1 influences Aurora B activity through an additional pathway. Our findings establish KNL1 as a requirement for Aurora B activity at kinetochores and for wild-type kinetochore–MT attachment dynamics.


Figures

Figure 1.
Figure 1.
KNL1 is required for Aurora B kinase-mediated Hec1 phosphorylation at the kinetochore. (A) Control and KNL1-depleted HeLa cells immunostained with KNL1 and tubulin antibodies. Kinetochore fluorescence intensities were measured after KNL1 depletion using a KNL1 antibody. Error bars represent SD from independent experiments (n = 3). For each experiment n ≥ 100 kinetochores were measured from at least 10 cells. (B) Western blot of HeLa cell extracts from control and KNL1 siRNA-treated cells immunostained with KNL1 and β-actin antibodies. Percentage lysate loaded in the gel is indicated. Quantification of band intensities indicates that KNL1 levels were decreased by 96%. (C–G) Control and KNL1-depleted HeLa cells were immunostained with Hec1 phosphospecific antibodies (C and D), a non-phosphospecific Hec1 antibody (E, 9G3), a phosphospecific Aurora B antibody (G, pT232), and kinetochore fluorescence intensities were quantified. Error bars in graphs represent SD from independent experiments (n = 3 for Aurora B pT232 and Hec1 pSer44; n = 2 for Hec1 pSer55). For each experiment n ≥ 100 kinetochores were measured from at least 10 cells. ***, P < 0.001 (Mann-Whitney rank sum test). Fluorescence intensities are indicated as percentages in (E, left). (E, right) Western blot of control and KNL1-depleted HeLa extracts. Blots were probed with antibodies to Hec1 and tubulin as a loading control. (F) Levels of phospho-Hec1 remaining at kinetochores calculated as a ratio of phospho-Hec1 fluorescence intensities from C and D to total Hec1 remaining at kinetochores after KNL1 depletion (58%) in E. See C and D above for n values and statistics. (A–G) Error bars in all controls represent SD between cells. Bars: (cell panels) 5 µm; (kinetochore pair insets) 0.5 µm.
Figure 2.
Figure 2.
KNL1 is required for wild-type kinetochore–MT dynamics. (A) Representative images of control, ZM-treated, and KNL1-depleted early mitotic HeLa cells subjected to a cold-induced MT depolymerization assay and immunostained for tubulin and a kinetochore marker (ACA). Total spindle fluorescence intensities are shown for each condition. Error bars in graph represent SD from independent experiments (n = 2). For each experiment n ≥ 8 cells per condition. ***, P < 0.001 (Mann-Whitney rank sum test); NS, not statistically significantly different. (B) Kymographs of sister kinetochore pairs from live-cell time-lapse imaging sequences in control and KNL1-depleted HeLa cells. Kymographs were generated from the kinetochore pairs indicated in the panels below (arrows). (C) Plots of kinetochore tracks over time in control and KNL1-depleted HeLa cells. For each condition, two representative sister kinetochore pairs are shown. (D) Quantification of kinetochore oscillations in control and KNL1-depleted cells. DAP indicates deviation from average position, a measure of oscillation amplitude (Stumpff et al., 2008). Error bars represent SD from independent experiments (n = 3). For each experiment n ≥ 32 kinetochores were tracked from at least 5 cells. ***, P < 0.001 (t test). Bars, 5 µm.
Figure 3.
Figure 3.
The N terminus of KNL1 promotes Aurora B activity. (A) Schematic of GFP-KNL1 constructs stably incorporated into Flp-In T-REx HeLa cell lines; the exact amino acids of all KNL1 constructs shown are as follows: aa 1–300 (300N), 300–818 (300-800N), 1174–2316 (1200C), 1519–2316 (800C), 819–2316 (1500C), and 2056–2316 (250C). (B–G) Flp-In T-REx HeLa cells were depleted of endogenous KNL1, rescued with the indicated GFP-KNL1 fragment upon doxycycline addition, and immunostained with the indicated antibodies. Kinetochore fluorescence intensities were quantified as indicated in the graphs. Error bars represent SD from independent experiments; (B and C) Aurora B pT232 (n = 3), (D and E) Hec1 pSer44 (n = 2), (F and G) Aurora B (n = 3). For each experiment n ≥ 100 kinetochores were measured from at least 8 cells. ***, P < 0.001; **, P < 0.05; NS, not statistically significantly different (Mann-Whitney rank sum test). Bars, 5 µm.
Figure 4.
Figure 4.
The N-terminal region of KNL1 is sufficient to recover Aurora B activity at kinetochores. (A) Quantification of kinetochore fluorescence intensities measured using the Hec1 9G3 antibody in stable HeLa FlpIn T-Rex cell lines expressing KNL1 fragments; n ≥ 100 kinetochores and n ≥ 5 cells. No statistical differences were found between control and HeLa stable cell lines expressing KNL1 fragments. (B) Quantification of phospho-Dsn1 at kinetochores in cells expressing KNL1 fragments; n ≥ 100 kinetochores and n ≥ 5 cells, n = 3 independent experiments. For control and KNL1 siRNA panels, cells were stained with ACA and pDsn1 antibodies. For doxycycline-induced cell lines, cells were stained with pDsn1 antibodies and the GFP fluorescence is shown. The 300N cell line is shown in the panel for control and KNL1 siRNA. (C) Quantification of phospho-INCENP at kinetochores in cells expressing KNL1 fragments. The data shown are from a single representative experiment out of two repeats. For the experiment shown, n ≥ 100 kinetochores and n ≥ 5 cells. The 300N cell line is shown in the panel for control and KNL1 siRNA. Error bars represent SD between cells (Mann-Whitney rank sum test). (A and B) In all cases error bars represent SD between independent experiments. ***, P < 0.001; NS, not statistically significantly different (Mann-Whitney rank sum test). (D) Ratios between the average Aurora B pT232 and pINCENP fluorescence intensities and between Aurora B pT232 and AIM1 fluorescence intensities for each KNL1 mutant cell line are shown as bar graphs. The pT232/pINCENP ratio suggests that pT232 and pINCENP levels are highly correlated between cell lines. The pT232/cenABK(AIM1) ratio suggests that pT232 and cenABK are not highly correlated. See Fig. 3, C and G, and panel C above for n values and statistics. Bars, 5 µm.
Figure 5.
Figure 5.
The KNL1 N terminus partially rescues wild-type MT dynamics and kinetochore–MT attachment regulation. (A–D) Flp-In T-REx HeLa cells were depleted of endogenous KNL1, rescued with the indicated GFP-KNL1 fragment upon doxycycline addition and analyzed for oscillatory kinetochore movements and inter-kinetochore distances in metaphase. (A) Kymographs of sister kinetochore pairs from live-cell time-lapse imaging sequences. Bar, 1 µm. (B) Representative plots of kinetochore tracks over time in cells expressing the indicated fragments. (C) Quantification of kinetochore oscillations. DAP indicates deviation from average position; n ≥ 12 kinetochores per cell line. Error bars represent SD between cells. ***, P < 0.001 (t test). (D) Inter-kinetochore distances were measured on bi-oriented sister kinetochore pairs using ACA as a kinetochore marker. Error bars represent SD from independent experiments (n = 3). For each experiment n ≥ 100 kinetochores were measured from at least 5 cells. ***, P < 0.001 (t test). NS, not statistically significantly different (Mann-Whitney rank sum test).
Figure 6.
Figure 6.
KNL1 N terminus is required for Bub1 kinase activity at the kinetochore. (A) Control and Bub1-depleted HeLa cells were immunostained with antibodies to Aurora B pT232 (left panels) or Hec1 pSer44 (right panels). Kinetochore fluorescence intensities are shown. Error bars represent SD from independent experiments (n = 2). For each experiment n ≥ 50 kinetochores were measured from at least 6 cells. (B–D) Flp-In T-REx HeLa cells were depleted of endogenous KNL1, rescued with the indicated GFP-KNL1 fragment upon doxycycline addition, and immunostained with Bub1 (B), histone H2A pT120 (D), or overexpressing hBub1-mCherry (C). Kinetochore fluorescence intensities were quantified. In B and D, error bars represent SD from independent experiments (n = 3 in B; n = 2 in D). For each experiment n ≥ 100 kinetochores, n ≥ 10 cells in B; n ≥ 50 kinetochores, n ≥ 5 cells in D. ***, P < 0.001; NS, not statistically significantly different (Student’s t test). (C) Live-cell imaging in control and 300N KNL1 cells expressing Bub1-mCherry and treated with nocodazole. Time is indicated in minutes. Upon KNL1 depletion 90% of cells had no detectable Bub1 at kinetochores, while 10% of cells showed high levels of Bub1, presumably due to incomplete knockdown. (E) Schematic of GFP-KNL1 300N fragments containing mutations in the MELT or KI motifs. The wild-type (top) and mutated (bottom) sequences are shown. (F) HeLa cells depleted of endogenous KNL1 were rescued with N-terminal GFP-tagged 300N, 300N-KI (300N-KI/A), or 300N-MELT (300N-MELT/A) mutants and immunostained for histone H2A pT120. Bars: (cell panels) 5 µm; (kinetochore pair insets) 0.5 µm.
Figure 7.
Figure 7.
Aurora B accumulation is not sufficient for wild-type levels of Aurora B activity in KNL1-depleted cells. (A) Schematic of the localization of CB-INCENP and HP1-Survivin chimeras (top) and schematized experimental procedure (bottom). (B) Line scans of sister kinetochore pairs from HeLa cells expressing CB-INCENP or HP1-Survivin and immunostained with the indicated antibodies. Line scans show the fluorescence intensity across sister kinetochores for a pan-antibody to Aurora B (AIM1) or Aurora B pT232 antibody and the kinetochore markers Bub1 or KNL1. Line scans represent the average position of at least 30 kinetochores per condition. (C–E) Normalized kinetochore fluorescence intensities of control and KNL1-depleted HeLa cells expressing either CB-INCENP or HP1-Survivin and immunostained with antibodies to Aurora B pT232 (C and D) or Aurora B (AIM1, D and E). Scatter plots show intensities at individual kinetochores for Aurora B pT232 or Aurora B (AIM1) versus GFP intensities of the indicated chimera. C shows n ≥ 180 kinetochores from at least 10 cells and 3 independent experiments; D shows n ≥ 50 kinetochores from at least 8 cells; E shows n ≥ 180 kinetochores from at least 8 cells and 2 independent experiments. Graphs in C and E (right) represent the mean and SD from independent experiments. ***, P < 0.001; NS, not statistically significantly different (Mann-Whitney rank sum test). (F) Control and KNL1-depleted HeLa cells expressing CB-INCENP and immunostained with a Hec1 phosphospecific antibody to Ser44. Fluorescence intensity quantification is shown on the right. ***, P < 0.001 (t test). Bars: (cell panels) 5 μm; (kinetochore pair insets) 0.5 μm.
Figure 8.
Figure 8.
Model for KNL1-mediated Aurora B activation. In early mitosis, phosphorylation of outer kinetochore substrates relies on Aurora B kinase activity, which is dependent on the N terminus of KNL1. KNL1-mediated Bub1 kinase activity enhances Aurora B activation at both the inner centromere and the kinetochore. Upon generation of stable kinetochore–MT attachments and sister kinetochore bi-orientation, KNL1 is no longer able to mediate Bub1 kinase activity and Bub1 accumulation, resulting in decreased levels of active Aurora B. During metaphase, reduced levels of active Aurora B at the kinetochore region (DeLuca et al., 2011) lead to further stabilization of kinetochore–MT attachments and checkpoint silencing (mediated in part through PP1 binding; Meadows et al., 2011; Rosenberg et al., 2011).

References

    1. Biggins S., Severin F.F., Bhalla N., Sassoon I., Hyman A.A., Murray A.W. 1999. The conserved protein kinase Ipl1 regulates microtubule binding to kinetochores in budding yeast. Genes Dev. 13:532–544 10.1101/gad.13.5.532 - DOI - PMC - PubMed
    1. Bolanos-Garcia V.M., Lischetti T., Matak-Vinković D., Cota E., Simpson P.J., Chirgadze D.Y., Spring D.R., Robinson C.V., Nilsson J., Blundell T.L. 2011. Structure of a Blinkin-BUBR1 complex reveals an interaction crucial for kinetochore-mitotic checkpoint regulation via an unanticipated binding site. Structure. 19:1691–1700 10.1016/j.str.2011.09.017 - DOI - PMC - PubMed
    1. Campbell C.S., Desai A. 2013. Tension sensing by Aurora B kinase is independent of survivin-based centromere localization. Nature. 497:118–121 10.1038/nature12057 - DOI - PMC - PubMed
    1. Cheeseman I.M., Chappie J.S., Wilson-Kubalek E.M., Desai A. 2006. The conserved KMN network constitutes the core microtubule-binding site of the kinetochore. Cell. 127:983–997 10.1016/j.cell.2006.09.039 - DOI - PubMed
    1. Cheeseman I.M., Hori T., Fukagawa T., Desai A. 2008. KNL1 and the CENP-H/I/K complex coordinately direct kinetochore assembly in vertebrates. Mol. Biol. Cell. 19:587–594 10.1091/mbc.E07-10-1051 - DOI - PMC - PubMed

Publication types

MeSH terms