. 2014 Mar;34(5):847-61.
doi: 10.1128/MCB.01551-13. Epub 2013 Dec 16.

TIMMDC1/C3orf1 functions as a membrane-embedded mitochondrial complex I assembly factor through association with the MCIA complex

Affiliations

TIMMDC1/C3orf1 functions as a membrane-embedded mitochondrial complex I assembly factor through association with the MCIA complex

Virginia Guarani et al. Mol Cell Biol. 2014 Mar.

Abstract

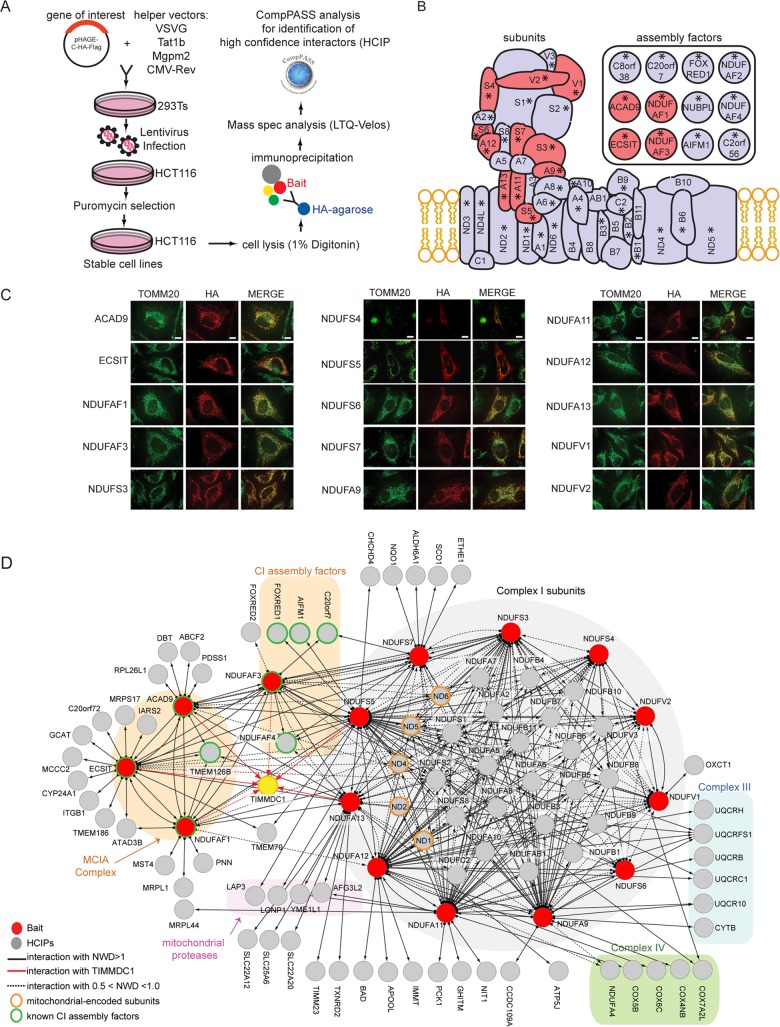
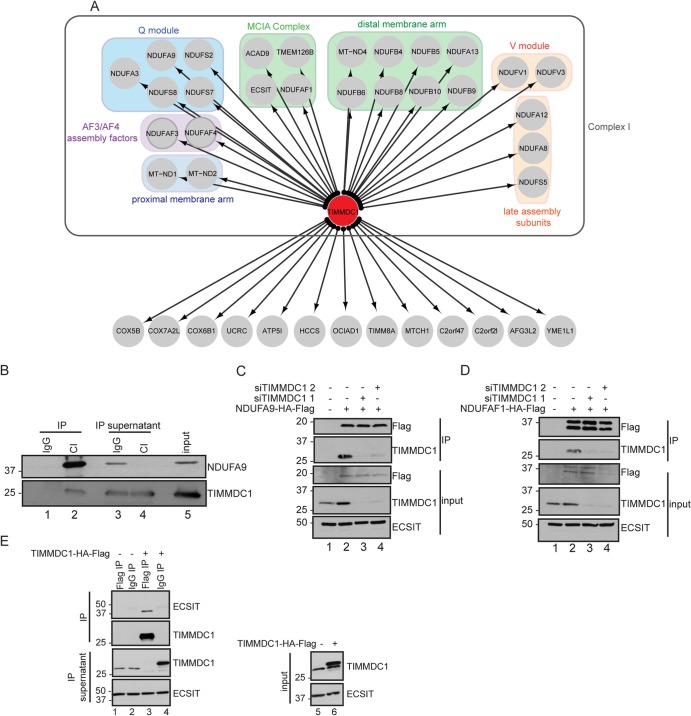
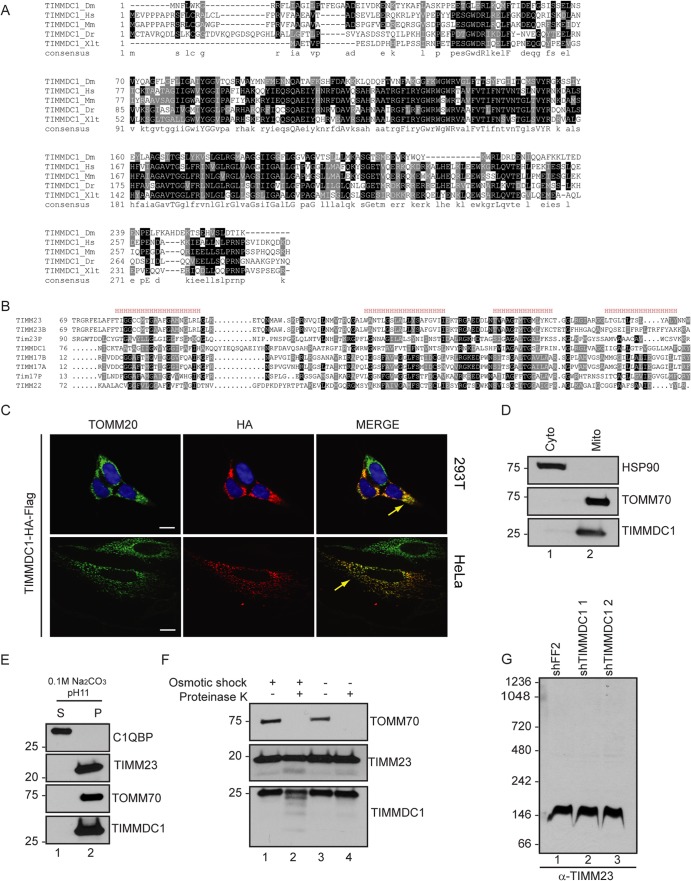
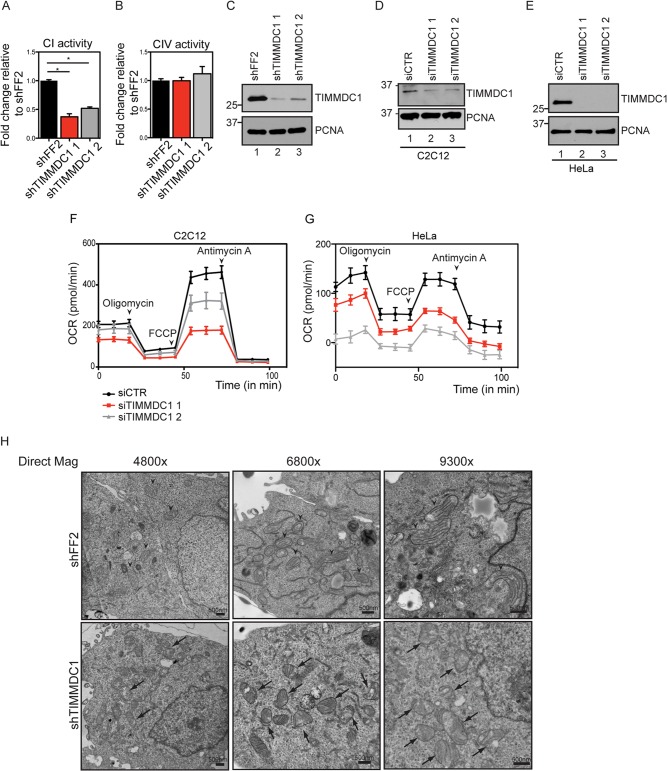
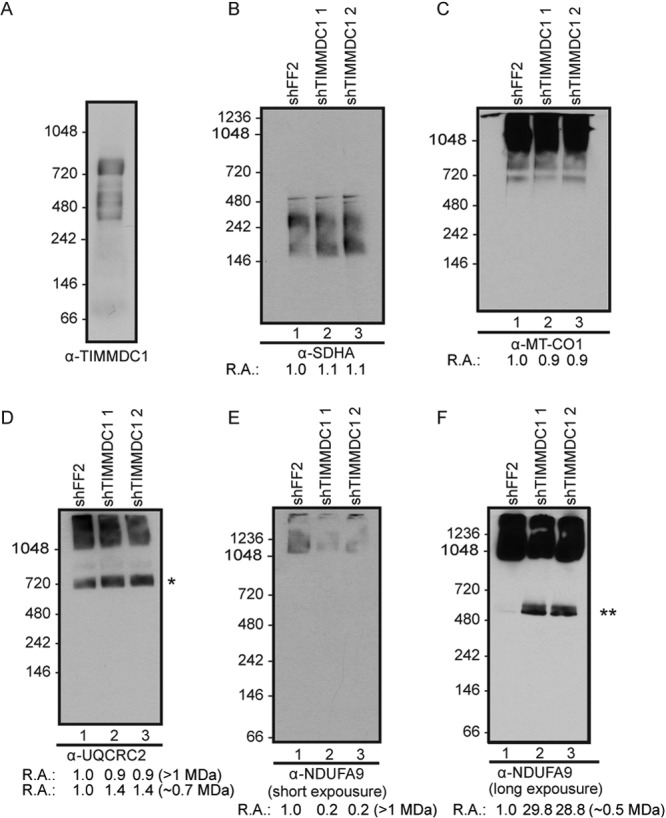
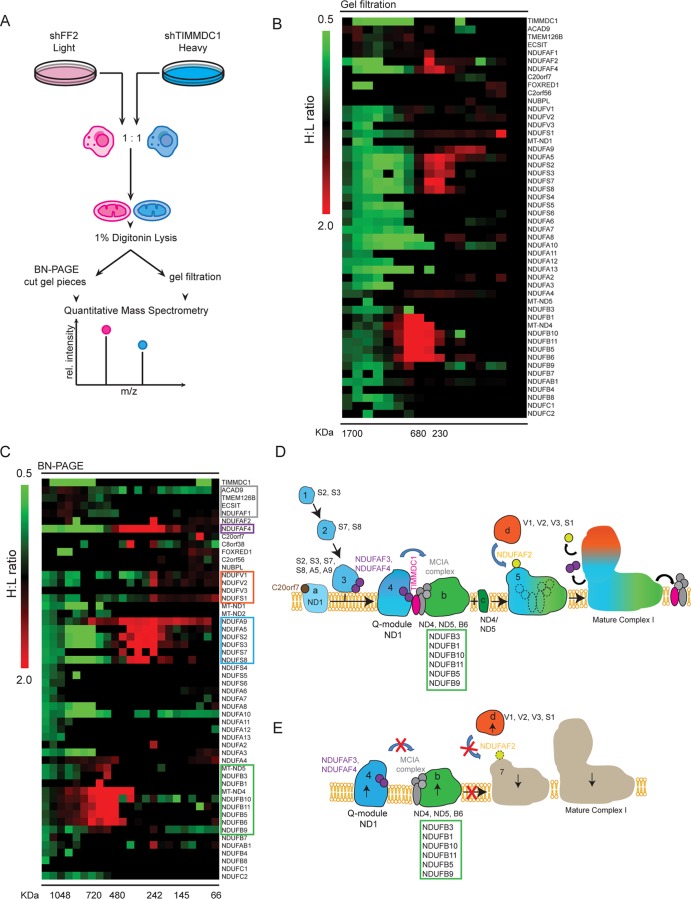
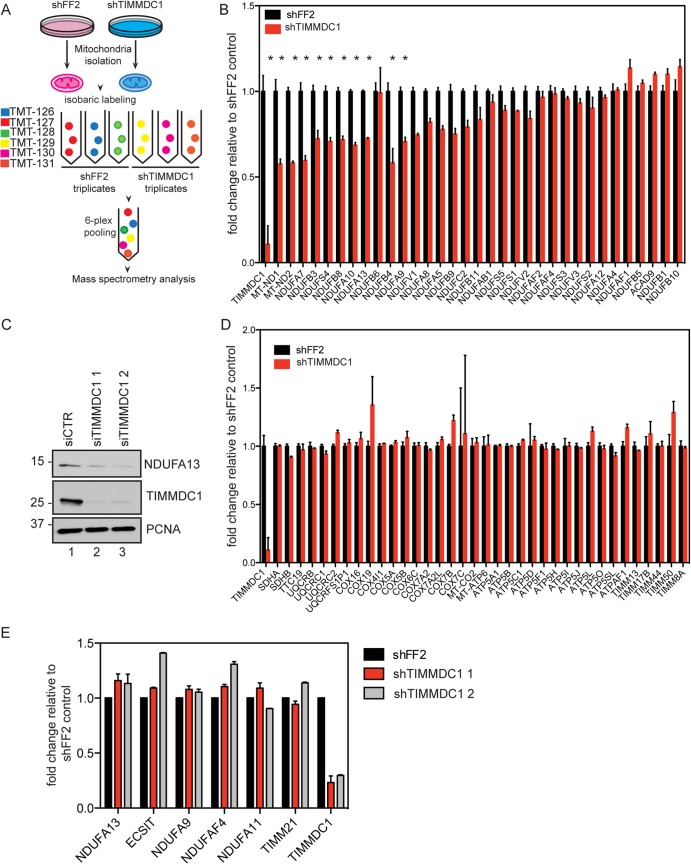
Complex I (CI) of the electron transport chain, a large membrane-embedded NADH dehydrogenase, couples electron transfer to the release of protons into the mitochondrial inner membrane space to promote ATP production through ATP synthase. In addition to being a central conduit for ATP production, CI activity has been linked to neurodegenerative disorders, including Parkinson's disease. CI is built in a stepwise fashion through the actions of several assembly factors. We employed interaction proteomics to interrogate the molecular associations of 15 core subunits and assembly factors previously linked to human CI deficiency, resulting in a network of 101 proteins and 335 interactions (edges). TIMMDC1, a predicted 4-pass membrane protein, reciprocally associated with multiple members of the MCIA CI assembly factor complex and core CI subunits and was localized in the mitochondrial inner membrane, and its depletion resulted in reduced CI activity and cellular respiration. Quantitative proteomics demonstrated a role for TIMMDC1 in assembly of membrane-embedded and soluble arms of the complex. This study defines a new membrane-embedded CI assembly factor and provides a resource for further analysis of CI biology.


Figures

FIG 1
FIG 1
Systematic interaction proteomic analysis of 11 CI subunits and 4 assembly factors. (A) Schematic representation of the experimental work flow utilized for the identification of HCIPs for CI subunits and assembly factors. (B) Schematic illustration of CI topology. The schematic representation is based on a previously proposed model, but ambiguity exists in the locations of some subunits (44). Proteins tagged for immunoprecipitation are highlighted in red. Assembly factors are represented separately in the inset. The subunits with asterisks are mutated in patients with CI deficiency. (C) Immunofluorescence analysis of the subcellular localization of tagged proteins. HeLa cells transiently expressing the indicated baits fused with a C-terminal HA-Flag tag were stained with anti-HA (red) and the mitochondrial marker anti-TOMM20 (green). Scale bars, 10 μm (applies to all images). (D) Overview of the CI interaction network obtained from IP-MS analysis of 15 baits (red nodes) consisting of 4 assembly factors and 11 core subunits. Subnetworks representing discrete functional groups are color coded. Interactions with TIMMDC1 are indicated by red lines. Solid lines indicate an NWD score >1, and dotted lines indicate an NWD score between 0.5 and 1.0.
FIG 2
FIG 2
TIMMDC1 interaction network. (A) IP-MS followed by CompPASS analysis of C-terminally tagged TIMMDC1. The bait (TIMMDC1) is represented by a red node, and HCIPs are represented in gray. Distinct functional protein groups are color coded. (B) Endogenous interaction between TIMMDC1 and CI. An antibody directed against the fully assembled form of endogenous CI was used to capture CI from mitochondrial lysates. Western blot analysis was performed with anti-NDUFA9 as a control for CI pulldown efficiency and with antibodies against endogenous TIMMDC1. (C and D) C-terminally tagged NDUFA9 and NDUFAF1 were immunopurified from 293T cells, and Western blot analysis was performed to detect the interaction with endogenous TIMMDC1. TIMMDC1 siRNA-mediated depletion was used to confirm the specificity of the interaction. (E) C-terminally tagged TIMMDC1 was immunopurified from 293T cells, and Western blot analysis was performed to detect an interaction with endogenous ECSIT.
FIG 3
FIG 3
TIMMDC1 is a conserved mitochondrial inner membrane protein. (A) Amino acid conservation of TIMMDC1 across species. An alignment was performed using Clustal O. Dm, Drosophila melanogaster; Hs, Homo sapiens; Mm, Mus musculus; Dr, Danio rerio; Xlt, Xenopus laevis tropicalis. Black shading, identical residue; gray shading, >50% identical. (B) Alignment of TIMMDC1 with other members of the Tim17-23 protein family (generated with the MAFFT algorithm [http://mafft.cbrc.jp/alignment/server/]) and prediction of TIMMDC1 transmembrane helices (represented by H). (C) Immunofluorescence images showing subcellular localization of C-terminally tagged TIMMDC1 in 293T and HeLA cells. Exogenous TIMMDC1 was stained with anti-HA antibody and mitochondria with an anti-TOMM20 antibody. Scale bars, 10 μm (applies to all images). (D) Cytoplasmic (Cyto) and mitochondrial (Mito) fractions from HCT116 were separated by differential centrifugation. anti-HSP90 antibody was used as a cytoplasm marker, and anti-TOMM70 antibody was used as a mitochondrial marker. Endogenous TIMMDC1 is shown in the mitochondrial fraction with an anti-TIMMDC1 antibody. (E) Carbonate extraction of mitochondrial membrane proteins. Antibodies against endogenous C1QBP, TIMM23, and TOMM70 were used to identify matrix and inner and outer membrane compartments, respectively. TIMMDC1 is shown in the mitochondrial membrane fraction with an anti-TIMMDC1 antibody. (F) TIMMDC1 localizes to the inner membrane compartment. Proteinase K was used to digest the outer membrane proteins of isolated mitochondria. Osmotic shock was performed in order to break the outer membrane and make the inner membrane compartment accessible to proteinase K digestion. TOMM70 and TIMM23 antibodies were used to decorate the outer and inner membrane compartments, respectively. (G) BN-PAGE, followed by immunotransfer to a nitrocellulose membrane, was probed with an antibody directed against endogenous TIMM23. Molecular mass markers (kDa) are shown on the left for panels D to G.
FIG 4
FIG 4
Altered CI function and mitochondrial morphology in cells depleted of TIMMDC1. (A and B) Histograms showing CI (A) and CIV (B) activities measured in stable cell lines expressing shFF2 or two different shRNAs targeting TIMMDC1. The bars (with standard errors of the mean [SEM]) show the means of 3 biological replicates, each one performed in technical triplicates. *, P < 0.05 (one-way ANOVA). (C) Western blot analysis showing TIMMDC1 stable knockdown efficiencies for two different shRNAs in HCT116 cells used for CI and CIV activity measurements. PCNA was used as a loading control. (D) Western blot analysis showing TIMMDC1 depletion efficiency after TIMMDC1 siRNA transfection in C2C12 cells. (E) Western blot analysis showing TIMMDC1 depletion efficiency after TIMMDC1 siRNA transfection in HeLa cells. (F) Oxygen consumption was measured in C2C12 cells transfected with control or TIMMDC1 siRNA. The oxygen consumption rate (pmol/min) was measured under baseline conditions and after oligomycin, FCCP, and antimycin A injections, as indicated by the arrowheads. (G) Oxygen consumption was measured as for panel D with HeLa cells depleted of TIMMDC1 using two siRNAs. (H) Transmission electron micrographs showing mitochondrial morphology in HCT116 stable cell lines expressing shFF2 or TIMMDC1 shRNA (arrowheads, mitochondria with normal crista structure; arrows, mitochondria with dirsupted crista structure). Scale bars, 500 nm. Molecular mass markers (kDa) are shown on the left for panels C to E.
FIG 5
FIG 5
TIMMDC1 depletion affects complex I assembly. BN-PAGE was followed by immunotransfer to nitrocellulose membranes and probing with antibodies directed against endogenous TIMMDC1, UQCRC2, MT-CO1, SDHA, and NDUFA9, as indicated, in HCT116 wild-type mitochondria (A) or stable cell lines (B to F) expressing shFF2 or two different shRNAs targeting TIMMDC1. In panel D, the asterisk denotes an anti-UQCRC2-positive complex with a size expected for CIII plus CIV, and in panel F, the double asterisk indicates a CI intermediate containing NDUFA9 formed upon TIMMDC1 depletion. Quantification of complexes (relative abundance [R.A.]) is provided under the immunoblots (see Materials and Methods). Molecular mass markers (kDa) are shown on the left.
FIG 6
FIG 6
Quantitative proteomics analysis of CI assembly. (A) Schematic representation of the SILAC-based quantitative mass spectrometry approach to analyzing CI assembly defects. Light (K0) labeled shFF2 and heavy (K8) labeled shTIMMDC1 stable cell lines were mixed at a 1:1 ratio, and mitochondria were subsequently isolated and lysed with 1% digitonin. (B and C) Mitochondrial protein complexes were separated either by FPLC gel filtration (B) in a Superose 6 column or using BN-PAGE (C) and sliced into 24 gel pieces. The proteins were subjected to tryptic digestion and analyzed by quantitative mass spectrometry. Heavy-to-light (H:L) ratios were calculated for CI subunits and assembly factors. The ratios were plotted in heat maps, where values of <1 are represented in green and values of >1 are represented in red. (D and E) Proposed model for the TIMMDC1 mechanism of action during CI assembly and the effect of TIMMDC1 depletion on the assembly process. Assembly intermediates observed to accumulate upon TIMMDC1 depletion in panel E are color coded to match the boxes of the same colors in panel C. The schematic representation is based on a previously proposed assembly model (11).
FIG 7
FIG 7
Quantitative proteomic analysis of mitochondrial lysates reveals a selective decrease in CI subunit abundance upon TIMMDC1 depletion. (A) Schematic representation of the TMT-based quantitative mass spectrometry analysis of the total protein content in mitochondria isolated from shFF2 control or shTIMMDC1 HCT116 stable cell lines. (B and D) Bar graphs showing TMT intensities for subunits and assembly factors in CI (B) or complexes II to V and the TIM inner membrane translocase (D) in TIMMDC1 stably depleted cells relative to an shFF2 control. The bars (with SEM) show the means of 3 technical replicates. (C) Immunoblot analysis of NDUFA13 protein levels in 293T cells transfected with control siRNA or two different siRNAs targeting TIMMDC1. The knockdown efficiency was analyzed with anti-TIMMDC1 antibody, NDUFA13 protein levels were analyzed with anti-NDUFA13 antibody, and anti-PCNA was used as a loading control. Molecular mass markers (kDa) are shown on the left. (E) Histogram showing qPCR analysis of expression of NDUFA13, ECSIT, NDUFA9, NDUFAF4, NDUFA11, TIMM21, and TIMMDC1 in shFF2 control or shTIMMDC1 HCT116 stable cell lines. The bars (with SEM) show the means of 3 biological replicates.

References

    1. Smeitink J, van den Heuvel L, DiMauro S. 2001. The genetics and pathology of oxidative phosphorylation. Nat. Rev. Genet. 2:342–352. 10.1038/35072063 - DOI - PubMed
    1. Moreno-Lastres D, Fontanesi F, García-Consuegra I, Martín MA, Arenas J, Barrientos A, Ugalde C. 2012. Mitochondrial complex I plays an essential role in human respirasome assembly. Cell Metab. 15:324–335. 10.1016/j.cmet.2012.01.015 - DOI - PMC - PubMed
    1. Lapuente-Brun E, Moreno-Loshuertos R, Acín-Pérez R, Latorre-Pellicer A, Colás C, Balsa E, Perales-Clemente E, Quirós PM, Calvo E, Rodríguez-Hernández MA, Navas P, Cruz R, Carracedo Á, López-Otín C, Pérez-Martos A, Fernández-Silva P, Fernández-Vizarra E, Enríquez JA. 2013. Supercomplex assembly determines electron flux in the mitochondrial electron transport chain. Science 340:1567–1570. 10.1126/science.1230381 - DOI - PubMed
    1. Carroll J, Shannon RJ, Fearnley IM, Walker JE, Hirst J. 2002. Definition of the nuclear encoded protein composition of bovine heart mitochondrial complex I: identification of two new subunits. J. Biol. Chem. 277:50311–50317. 10.1074/jbc.M209166200 - DOI - PubMed
    1. Baradaran R, Berrisford JM, Minhas GS, Sazanov LA. 2013. Crystal structure of the entire respiratory complex I. Nature 494:443–448. 10.1038/nature11871 - DOI - PMC - PubMed

Publication types

MeSH terms

Substances

LinkOut - more resources