. 2014 Jan 13;211(1):29-43.
doi: 10.1084/jem.20130720. Epub 2013 Dec 16.

Jab1 regulates Schwann cell proliferation and axonal sorting through p27

Affiliations

Jab1 regulates Schwann cell proliferation and axonal sorting through p27

Emanuela Porrello et al. J Exp Med. .

Abstract

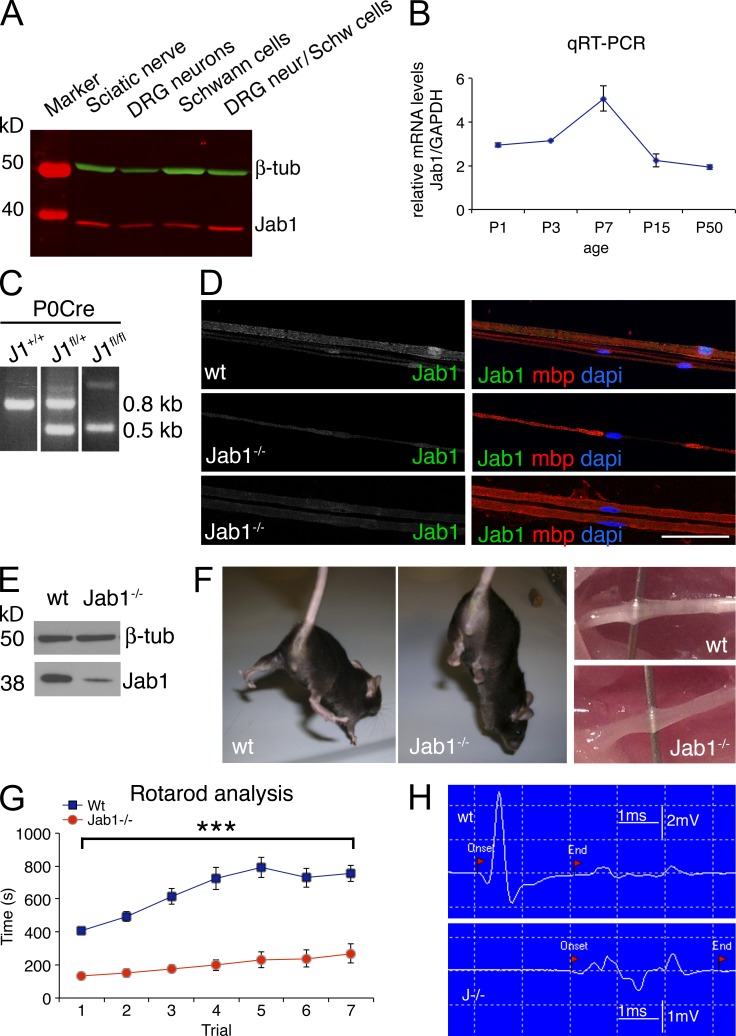
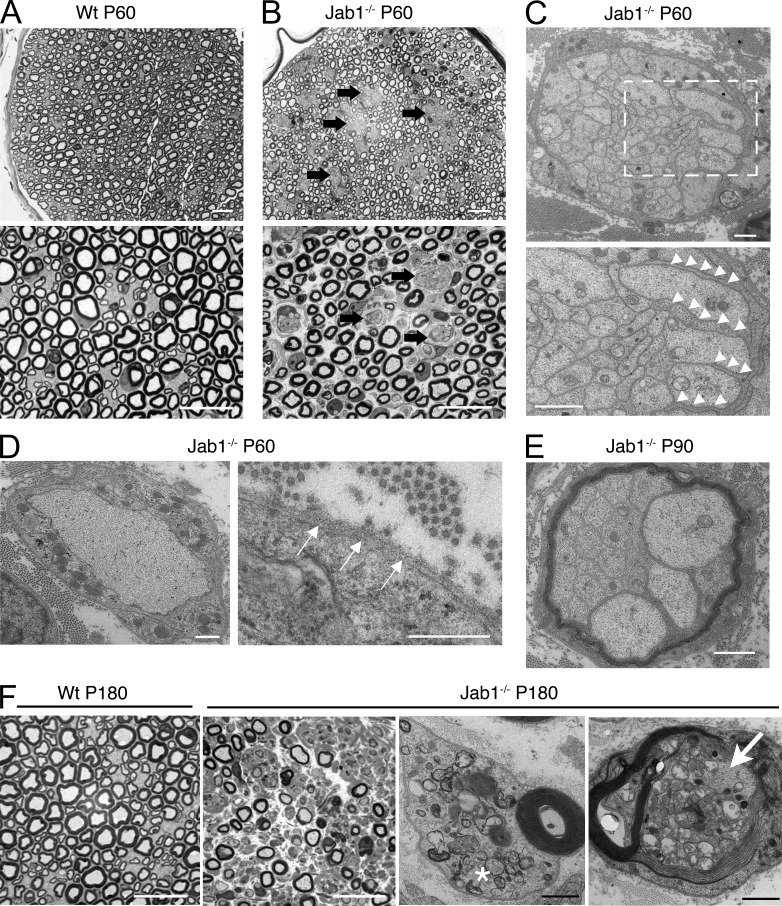
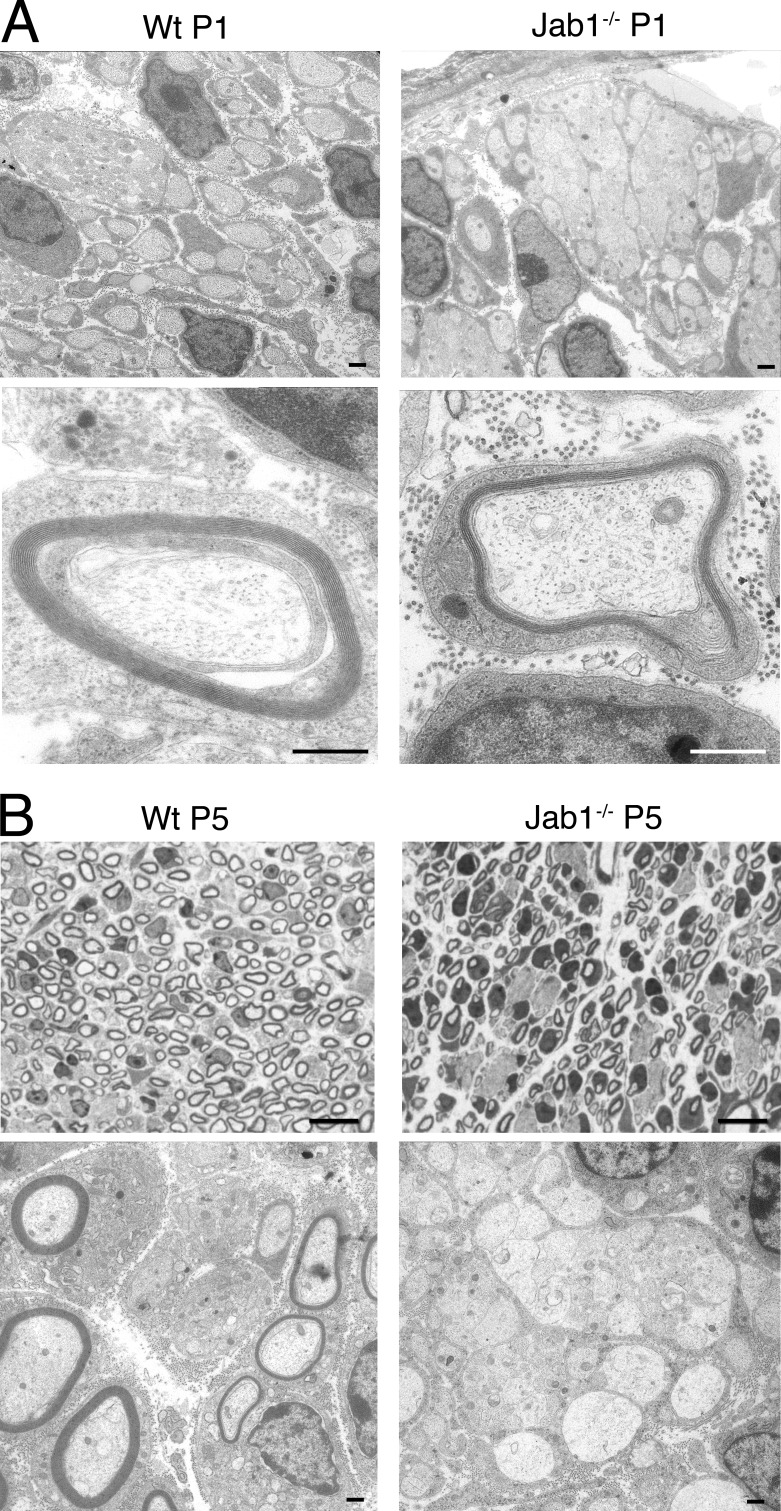
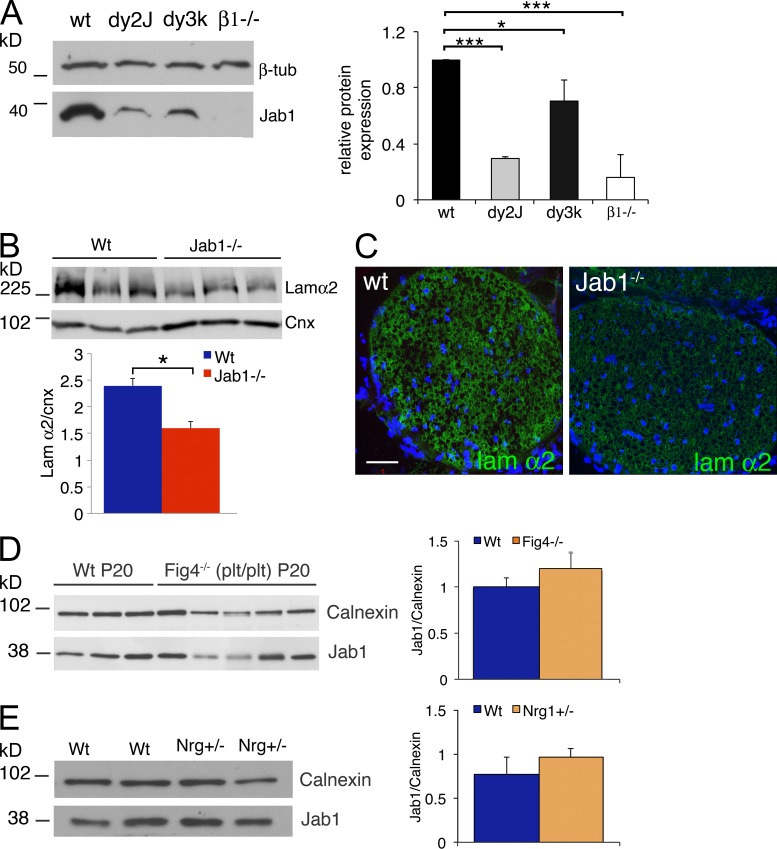
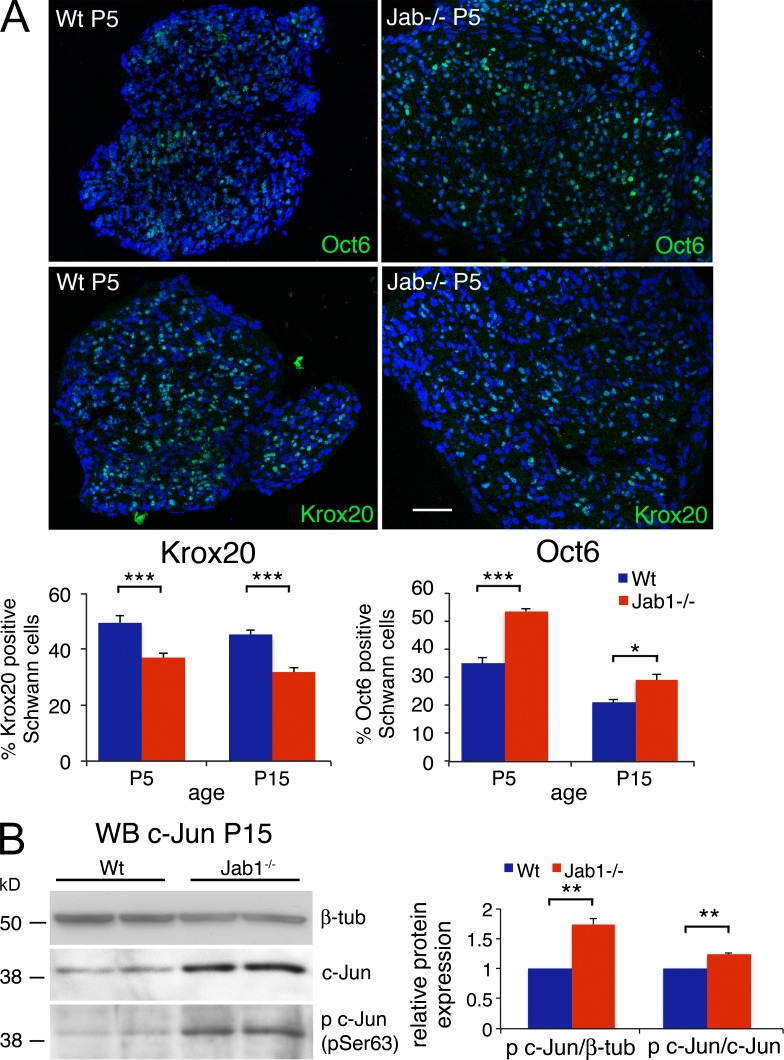
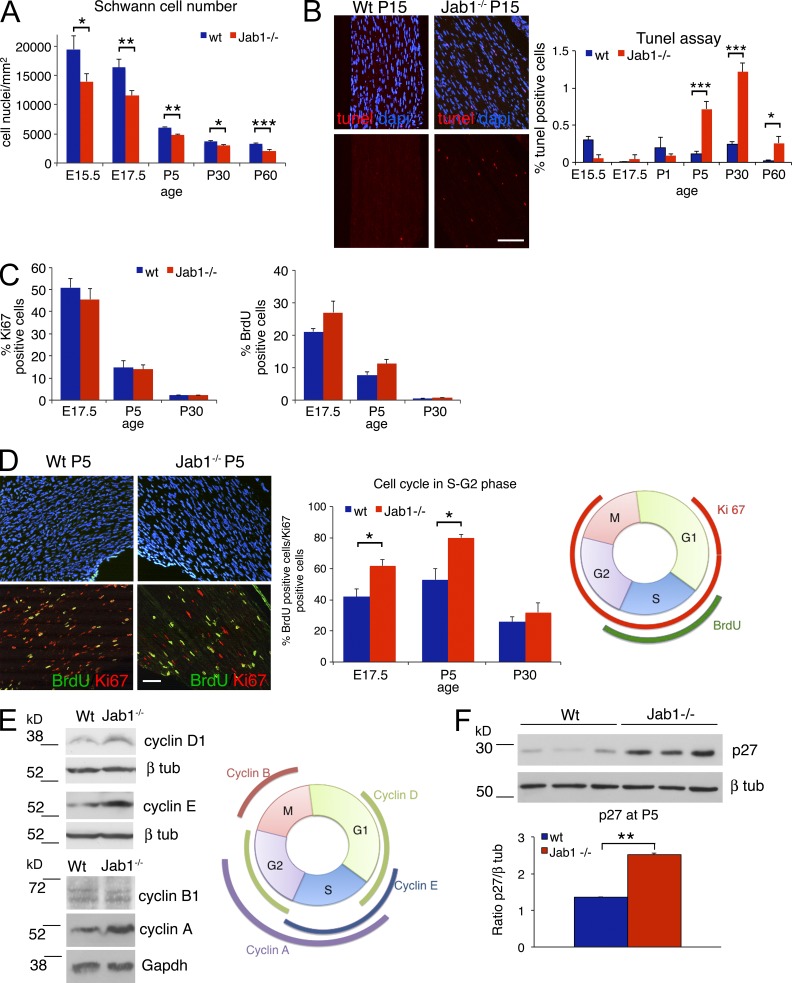
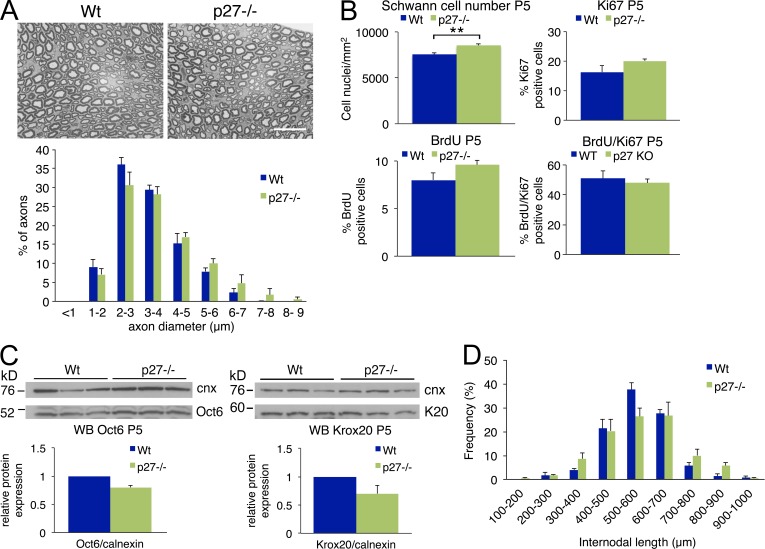
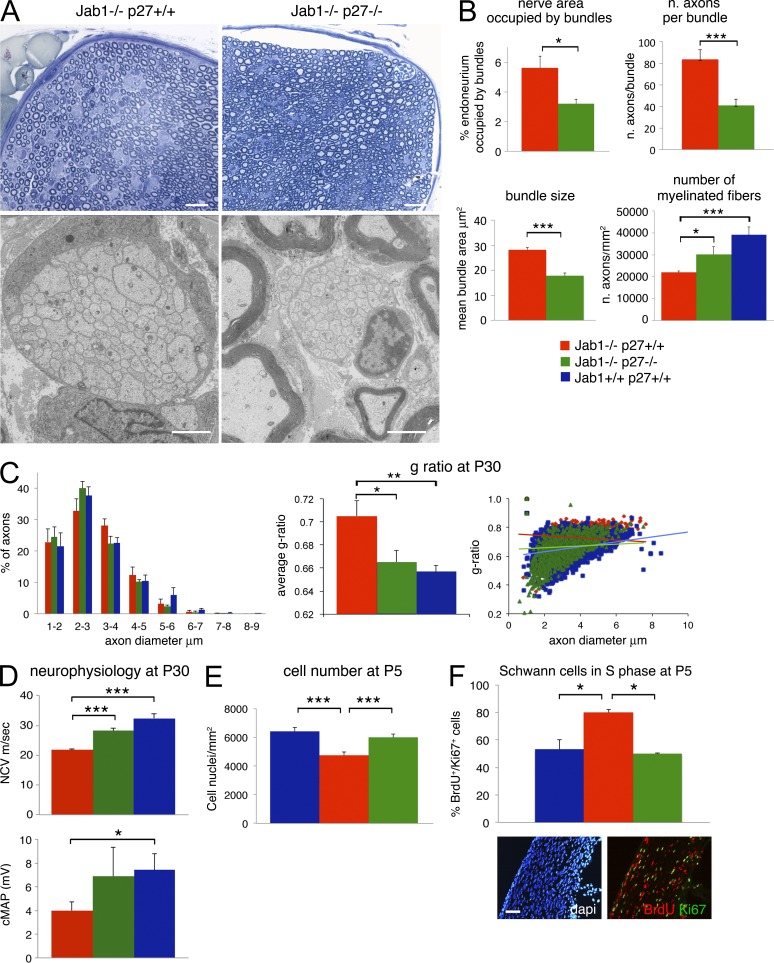
Axonal sorting is a crucial event in nerve formation and requires proper Schwann cell proliferation, differentiation, and contact with axons. Any defect in axonal sorting results in dysmyelinating peripheral neuropathies. Evidence from mouse models shows that axonal sorting is regulated by laminin211- and, possibly, neuregulin 1 (Nrg1)-derived signals. However, how these signals are integrated in Schwann cells is largely unknown. We now report that the nuclear Jun activation domain-binding protein 1 (Jab1) may transduce laminin211 signals to regulate Schwann cell number and differentiation during axonal sorting. Mice with inactivation of Jab1 in Schwann cells develop a dysmyelinating neuropathy with axonal sorting defects. Loss of Jab1 increases p27 levels in Schwann cells, which causes defective cell cycle progression and aberrant differentiation. Genetic down-regulation of p27 levels in Jab1-null mice restores Schwann cell number, differentiation, and axonal sorting and rescues the dysmyelinating neuropathy. Thus, Jab1 constitutes a regulatory molecule that integrates laminin211 signals in Schwann cells to govern cell cycle, cell number, and differentiation. Finally, Jab1 may constitute a key molecule in the pathogenesis of dysmyelinating neuropathies.


Figures

Figure 1.
Figure 1.
Jab1 expression in peripheral nerves and cre-mediated deletion of Jab1 in Schwann cells. (A) Western blot for Jab1 expression in the homogenate of isolated rat Schwann cells, DRG sensory neurons, co-culture of Schwann cells and DRG neurons, and sciatic nerve. Schwann cell and neuron lysates were obtained after 7 d in culture in defined media, whereas co-cultures were harvested 7 d after supplementation with ascorbic acid to induce myelination. β-Tubulin was used as loading control. (B) Quantitative RT-PCR for the expression of Jab1 in sciatic nerve during postnatal development. Each time point is the mean of five experiments (each experiment was performed with a pool of five to seven nerves). (C) Genotyping of sciatic nerve genomic DNA isolated from Jab1+/+ P0-cre (WT), Jab1fl/+ P0-cre (Jab+/−), and Jab1fl/fl P0-cre (Jab1−/−) mice. (D) Teased sciatic nerve fibers from P60 WT and Jab1−/− mice stained for Jab1 and Mbp. DAPI identifies the nucleus. Bar, 100 µm. (E) Western blot for Jab1 expression in the sciatic nerve homogenate of P5 WT and Jab1−/− mice. Representative figure of three independent experiments is shown. (F) Normal hindlimb postural reflex in a P60 WT mouse; abnormal reflex characterized by crossing of the limbs in Jab1−/− mouse. Images on the right show the appearance of sciatic nerve at gross examination before dissection in WT and Jab1−/− mice. (G) Rotarod analysis of motor function (seven repeated motor trials) in WT and Jab1−/− mice; paired Student’s t test analysis: ***, P ≤ 0.001; n = 13 mice per genotype. (H) Representative traces of sciatic nerve cMAP recorded from foot muscle after distal stimulation. Error bars indicate SEM.
Figure 2.
Figure 2.
Ablation of Jab1 results in defective axon sorting and myelination. (A and B) Semithin sections of P60 sciatic nerves from WT (A) and Jab1−/− (B) mice. Arrows identify bundles of unsorted axons in mutant nerves. (C) Electron micrographs of P60 sciatic nerves from Jab1−/− mice. Bundles of unsorted axons contain axons of different caliber, including those with diameter >1 µm. Bundles are entirely surrounded by Schwann cells that protrude processes within the axons; the boxed area is magnified below, and arrowheads identify Schwann cell protrusions within unsorted axons. (D) Electron micrographs of P60 sciatic nerves from Jab1−/− mice showing sorted but not myelinated axons and discontinuous basal lamina (arrows). (E) Electron micrographs of P90 sciatic nerves from Jab1−/− mice showing bundles of unsorted axons entirely myelinated (polyaxonal myelination). (F) Semithin and ultrathin sections of 6-mo-old sciatic nerve from WT and Jab1−/− mice. The asterisk identifies Schwann cell degeneration, and the arrow shows axonal degeneration. Bars: (A, B, and F [left]) 20 µm; (C [top], E, and F [right]) 1 µm; (C, bottom) 1.7 µm; (D) 0.5 µm.
Figure 3.
Figure 3.
Axonal sorting defect is present since early development. (A) Electron micrographs of sciatic nerve from P1 WT and Jab1−/− mice showing bundles of unsorted axons and myelinated fibers. (B) Semithin and ultrathin sections of sciatic nerve from P5 WT and Jab1−/− mice showing bundles of unsorted axons only in Jab1−/− nerves. Bars: (A and B [bottom]) 0.5 µm; (B, top) 10 µm.
Figure 4.
Figure 4.
Laminin211 and Jab1 influence each other’s expression. (A) Western blot for Jab1 protein in sciatic nerve homogenate of WT (P30), dy2J (P30), dy3K (P20), and β1 integrin−/− (P30) mice. Quantification is reported as the mean of three different mice per genotype (three independent experiments) and represented as ratio Jab1/β-tubulin, assigning WT as 1. (B) Western blot for laminin chain α2 in sciatic nerve homogenate of WT and Jab1−/− mice. Quantification is reported as the mean of three different mice per genotype) and represented as ratio laminin chain α2/calnexin. (C) Immunofluorescence staining for laminin chain α2 in P20 sciatic nerves of WT and Jab1−/− mice. Bar, 50 µm. (D) Western blot for Jab1 in sciatic nerve homogenate of P20 WT and Fig4−/− (plt/plt) mice. Quantification is reported as the mean of three different mice for WT and five mice for Fig4−/−. (E) Western blot for Jab1 in sciatic nerve homogenate of P30 WT and Nrg1 type III+/− mice. Quantification is reported as the mean of two different mice per genotype. (D and E) Calnexin was used as a loading control. Unpaired Student’s t test in A and paired Student’s t test in B, D, and E: *, P ≤ 0.05; ***, P ≤ 0.001. Error bars indicate SEM.
Figure 5.
Figure 5.
Schwann cells in mutant nerves show abnormal differentiation. (A) Quantification of Oct6- and Krox20-positive nuclei in transverse sciatic nerve sections of P5 and P15 WT and Jab1−/− mice (n = 5 per genotype per time point). Immunofluorescence at P5 is shown as a representative image. Bar, 50 µm. (B) Western blot for c-Jun and phosphorylated c-Jun (p c-Jun) in sciatic nerve homogenate of P15 WT and Jab1−/− mice. Quantification is reported as the mean of three different mice per genotype and represented as a ratio of phospho c-Jun/β-tubulin and phospho c-Jun/c-Jun, assigning WT as 1. Paired Student’s t test: *, P ≤ 0.05; **, P ≤ 0.01; ***, P ≤ 0.001. Error bars indicate SEM.
Figure 6.
Figure 6.
Schwann cells in mutant nerves are reduced in number and defective in cell cycle progression. (A) Quantification of Schwann cell number (S100 positive) in sciatic nerves of WT and Jab1−/− mice from E15.5 to P60 (n = 3 mice per genotype per time point). (B) Quantification of TUNEL-positive cells in sciatic nerve sections of WT and Jab1−/− mice from E15.5 to P60 (n = 4 mice per genotype per time point); immunofluorescence for TUNEL staining at P15 is shown as a representative image. (C) Quantification of Ki67- or BrdU-positive Schwann cells in sciatic nerves of WT and Jab1−/− mice at different time points (n = 3 mice per genotype). (D) Immunofluorescence representative for DAPI, BrdU, and Ki67 staining in sciatic nerves of WT and Jab1−/− mice at P5. The percentage of double-positive nuclei (BrdU/Ki67) on the total of Ki67-positive nuclei is quantified at E17.5, P5, and P30 (n = 3 mice per genotype per time point). A schematic representation of the cell cycle and phases marked by Ki67 and BrdU staining are shown on the right. (E) Western blot for cyclin levels in sciatic nerve homogenate of P5 WT and Jab1−/− mice. Each lane is a pool of 5 sciatic nerves for cyclin D1 and E or 10 sciatic nerves for cyclin B1 and A. The image is representative of two independent experiments. A schematic representation of cyclin expression in the different phases of cell cycle. (F) Western blot for p27 in sciatic nerve homogenate of P5 WT and Jab1−/− mice. Quantification is reported as the mean of three different mice per genotype and represented as ratio p27/β-tubulin. Paired Student’s t test: *, P ≤ 0.05; **, P ≤ 0.01; ***, P ≤ 0.001. Error bars indicate SEM. Bars: (B) 50 µm; (D) 30 µm.
Figure 7.
Figure 7.
Loss of p27 does not alter nerve development. (A) Semithin sections of sciatic nerve from P60 WT and p27−/− mice and fiber type distribution per axon diameter. Bar, 20 µm. (B) Quantification of Schwann cell number and percentage of BrdU-, Ki67-, and double BrdU/Ki67-positive staining in nerves of P5 WT and p27−/− mice (n = 3 mice per genotype per experiment). (C) Western blots for Oct6 and Krox20 in sciatic nerve homogenate of P5 WT and p27−/− mice. Calnexin was used as a loading control. Quantification is reported as the mean of three independent mice per genotype and represented as ratio Oct6 or Krox20/calnexin, assigning WT as 1. (D) Internodal length of P30 WT and p27−/− sciatic nerve (n = 100 fibers per mouse, three mice per genotype). Paired Student’s t test: **, P ≤ 0.01. Error bars indicate SEM.
Figure 8.
Figure 8.
Reduced levels of p27 rescue the peripheral nerve phenotype in Jab1-null mice. (A) Semithin and ultrathin sections of sciatic nerve from P30 Jab1−/− and double Jab1−/−p27−/− mice. (B) Morphometric analysis of the endoneurial area occupied by bundles of unsorted axons, number of axons per each bundle, mean bundle size, and number of sorted myelinated axons in Jab1−/− and double Jab1−/−p27−/− mice (n = 3 mice per genotype). (C) Analysis of fiber type distribution per axon diameter, mean g ratio, and g ratio per axon diameter in WT (n = 3 mice per genotype) and Jab1−/− and double Jab1−/−p27−/− mice (n = 5 mice per genotype). (D) Neurophysiology showing NCV and cMAP in P30 WT, Jab1−/−, and double Jab1−/−p27−/− mice (n = 3 mice per genotype). (E) Quantification of Schwann cell number in P5 sciatic nerves of WT, Jab1−/−, and Jab1−/−p27−/− mice (n = 3 mice per genotype). (F) Percentage quantification of nuclei double positive for BrdU and Ki67 staining on the total number of Ki67-positive nuclei in sciatic nerve sections of P5 WT, Jab1−/−, and Jab1−/−p27−/− mice (n = 3 mice per genotype). A representative immunofluorescence image of Jab1−/−p27−/− mice is shown. Bars: (A, top) 20 µm; (A, bottom) 2 µm; (F) 30 µm. Paired Student’s t test: *, P ≤ 0.05; **, P ≤ 0.01; ***, P ≤ 0.001. Error bars indicate SEM.

References

    1. Atanasoski S., Boller D., De Ventura L., Koegel H., Boentert M., Young P., Werner S., Suter U. 2006. Cell cycle inhibitors p21 and p16 are required for the regulation of Schwann cell proliferation. Glia. 53:147–157 10.1002/glia.20263 - DOI - PubMed
    1. Bardin A.J., Amon A. 2001. Men and sin: what’s the difference? Nat. Rev. Mol. Cell Biol. 2:815–826 10.1038/35099020 - DOI - PubMed
    1. Benninger Y., Thurnherr T., Pereira J.A., Krause S., Wu X., Chrostek-Grashoff A., Herzog D., Nave K.A., Franklin R.J., Meijer D., et al. 2007. Essential and distinct roles for cdc42 and rac1 in the regulation of Schwann cell biology during peripheral nervous system development. J. Cell Biol. 177:1051–1061 10.1083/jcb.200610108 - DOI - PMC - PubMed
    1. Berti C., Bartesaghi L., Ghidinelli M., Zambroni D., Figlia G., Chen Z.L., Quattrini A., Wrabetz L., Feltri M.L. 2011. Non-redundant function of dystroglycan and β1 integrins in radial sorting of axons. Development. 138:4025–4037 10.1242/dev.065490 - DOI - PMC - PubMed
    1. Birchmeier C., Nave K.A. 2008. Neuregulin-1, a key axonal signal that drives Schwann cell growth and differentiation. Glia. 56:1491–1497 10.1002/glia.20753 - DOI - PubMed

Publication types

MeSH terms