

Hydrological droughts in the 21st century, hotspots and uncertainties from a global multimodel ensemble experiment
- PMID: 24344266
- PMCID: PMC3948235
- DOI: 10.1073/pnas.1222473110
Hydrological droughts in the 21st century, hotspots and uncertainties from a global multimodel ensemble experiment
Abstract
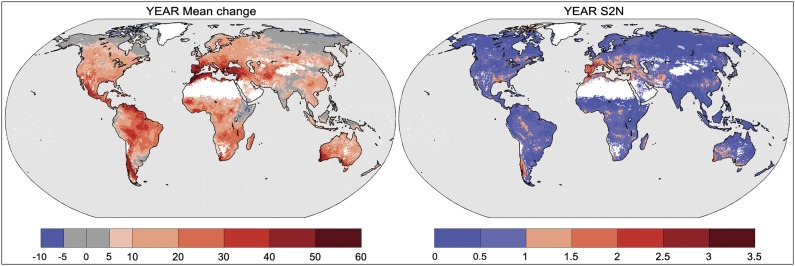
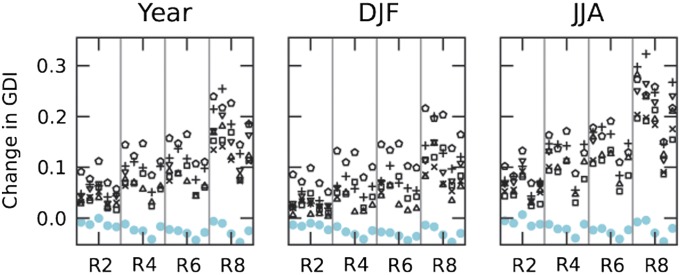
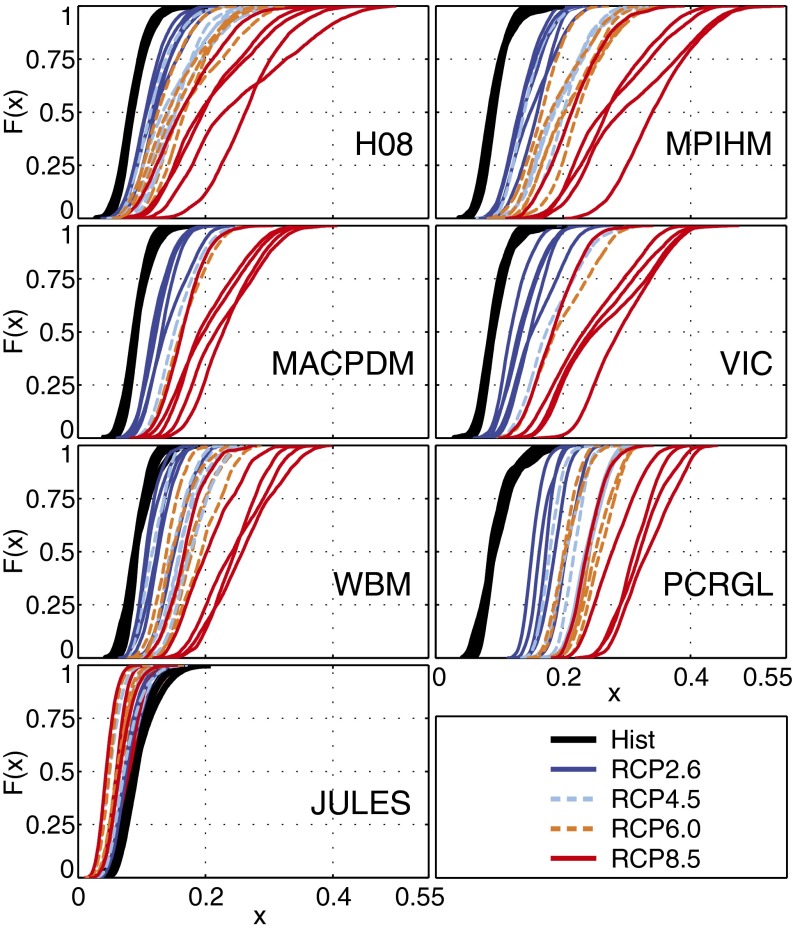
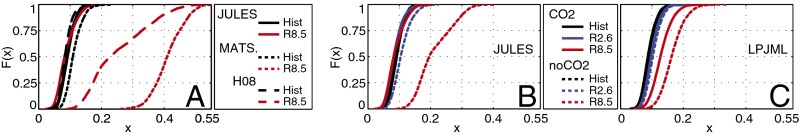
Increasing concentrations of greenhouse gases in the atmosphere are expected to modify the global water cycle with significant consequences for terrestrial hydrology. We assess the impact of climate change on hydrological droughts in a multimodel experiment including seven global impact models (GIMs) driven by bias-corrected climate from five global climate models under four representative concentration pathways (RCPs). Drought severity is defined as the fraction of land under drought conditions. Results show a likely increase in the global severity of hydrological drought at the end of the 21st century, with systematically greater increases for RCPs describing stronger radiative forcings. Under RCP8.5, droughts exceeding 40% of analyzed land area are projected by nearly half of the simulations. This increase in drought severity has a strong signal-to-noise ratio at the global scale, and Southern Europe, the Middle East, the Southeast United States, Chile, and South West Australia are identified as possible hotspots for future water security issues. The uncertainty due to GIMs is greater than that from global climate models, particularly if including a GIM that accounts for the dynamic response of plants to CO2 and climate, as this model simulates little or no increase in drought frequency. Our study demonstrates that different representations of terrestrial water-cycle processes in GIMs are responsible for a much larger uncertainty in the response of hydrological drought to climate change than previously thought. When assessing the impact of climate change on hydrology, it is therefore critical to consider a diverse range of GIMs to better capture the uncertainty.
Keywords: climate impact; evaporation; global hydrology; global warming.
Conflict of interest statement
The authors declare no conflict of interest.
Figures
References
-
- Trenberth KE. Conceptual framework for changes of extremes of the hydrological cycle with climate change. Clim Change. 1999;42:327–339.
-
- Field CB, et al. eds (2012) Managing the Risks of Extreme Events and Disasters to Advance Climate Change Adaptation. A Special Report of Working Groups I and II of the Intergovernmental Panel on Climate Change (Cambridge Univ Press, Cambridge, UK), p 582.
-
- Meehl GA, et al. Global Climate Projections. In: Solomon S, et al., editors. Climate Change 2007: The Physical Science Basis. Contribution of Working Group I to the Fourth Assessment Report of the Intergovernmental Panel on Climate Change. Cambridge, UK: Cambridge Univ Press; 2007. pp. 747–845.
-
- Lloyd-Hughes B, Shaffrey LC, Vidale PL, Arnell NW. An evaluation of the spatiotemporal structure of large-scale European drought within the HiGEM climate model. Int J Climatol. 2012;33(8):2024–2035.
Publication types
MeSH terms
LinkOut - more resources
Full Text Sources
Other Literature Sources
Medical
