. 2014 Jan 7;111(1):E119-28.
doi: 10.1073/pnas.1320777110. Epub 2013 Dec 16.

Effective functional maturation of invariant natural killer T cells is constrained by negative selection and T-cell antigen receptor affinity

Affiliations

Effective functional maturation of invariant natural killer T cells is constrained by negative selection and T-cell antigen receptor affinity

Romain Bedel et al. Proc Natl Acad Sci U S A. .

Abstract

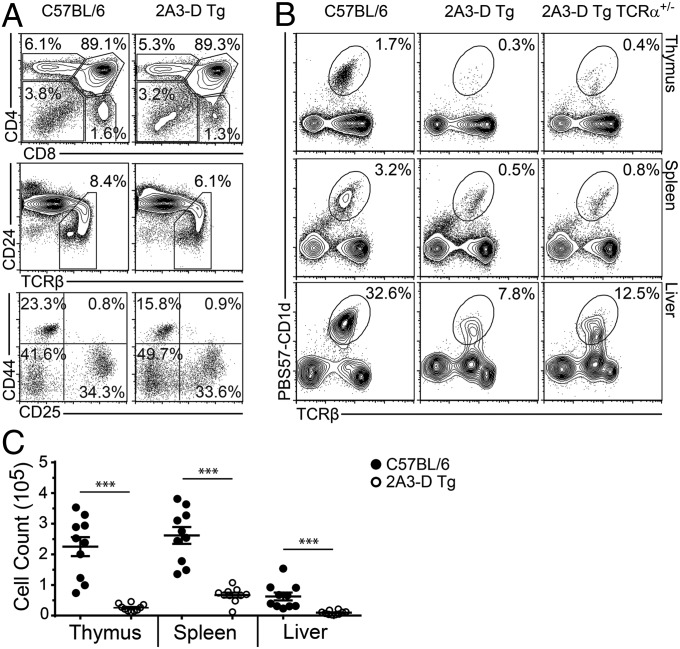
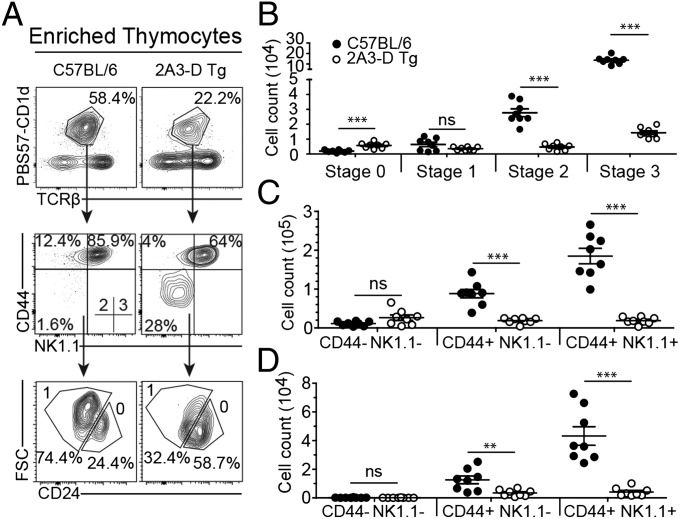
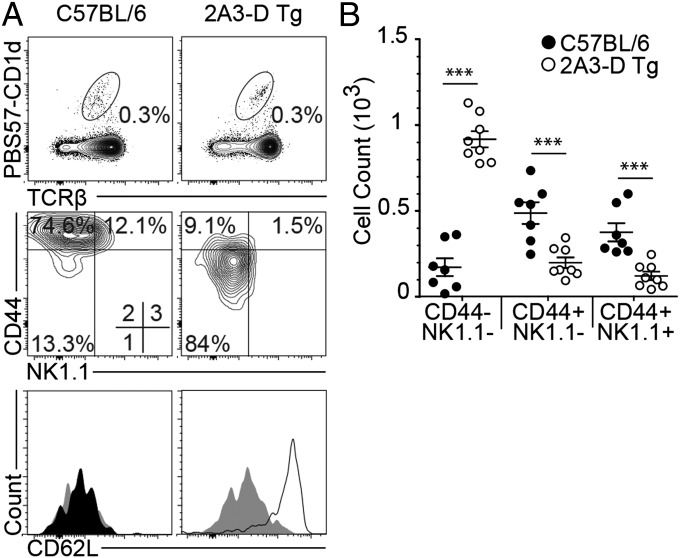
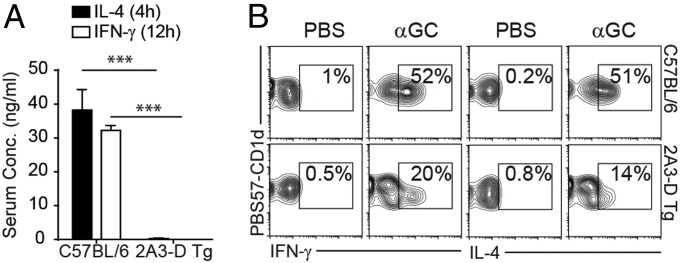
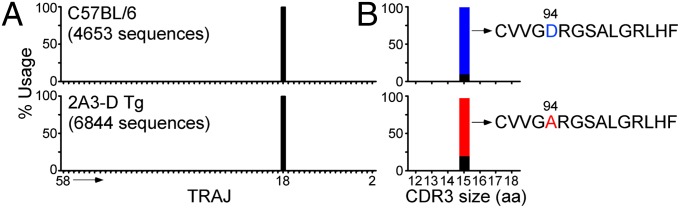
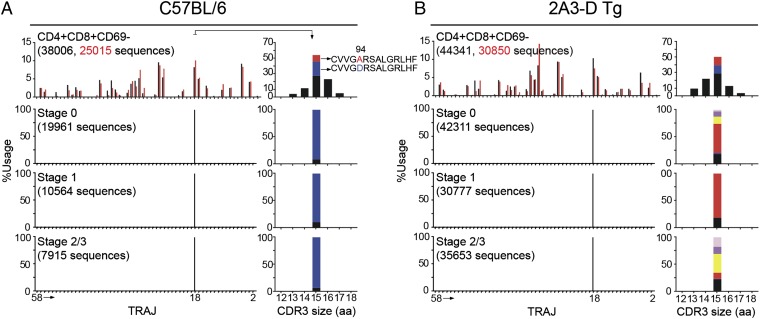
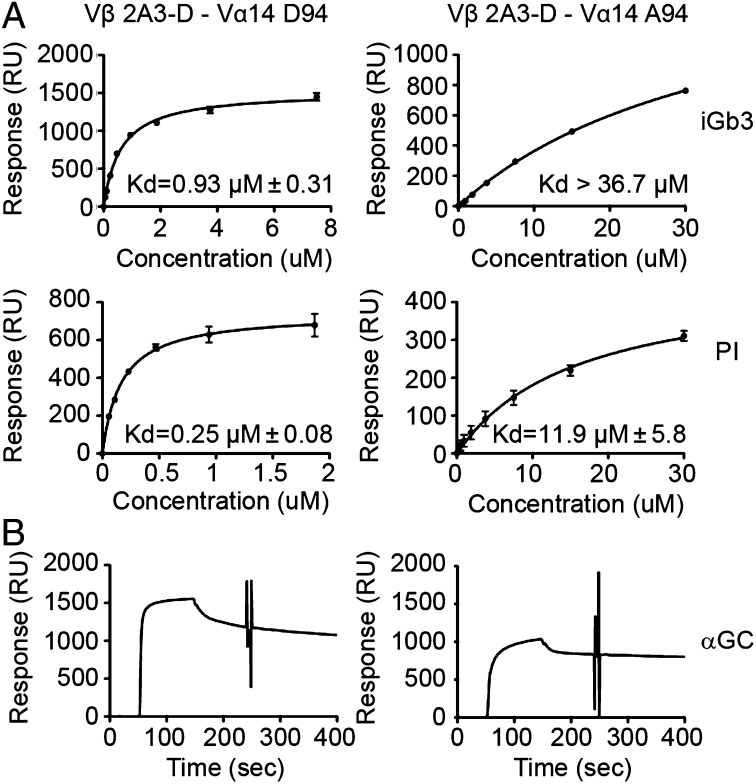
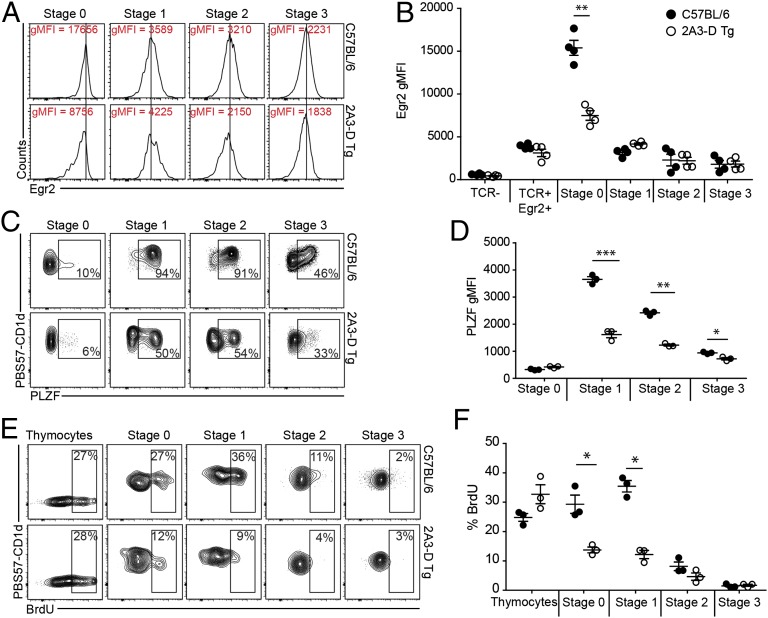
The self-reactivity of their T-cell antigen receptor (TCR) is thought to contribute to the development of immune regulatory cells, such as invariant NK T cells (iNKT). In the mouse, iNKT cells express TCRs composed of a unique Vα14-Jα18 rearrangement and recognize lipid antigens presented by CD1d molecules. We created mice expressing a transgenic TCR-β chain that confers high affinity for self-lipid/CD1d complexes when randomly paired with the mouse iNKT Vα14-Jα18 rearrangement to study their development. We show that although iNKT cells undergo agonist selection, their development is also shaped by negative selection in vivo. In addition, iNKT cells that avoid negative selection in these mice express natural sequence variants of the canonical TCR-α and decreased affinity for self/CD1d. However, limiting the affinity of the iNKT TCRs for "self" leads to inefficient Egr2 induction, poor expression of the iNKT lineage-specific zinc-finger transcription factor PLZF, inadequate proliferation of iNKT cell precursors, defects in trafficking, and impaired effector functions. Thus, proper development of fully functional iNKT cells is constrained by a limited range of TCR affinity that plays a key role in triggering the iNKT cell-differentiation pathway. These results provide a direct link between the affinity of the TCR expressed by T-cell precursors for self-antigens and the proper development of a unique population of lymphocytes essential to immune responses.

Keywords: deletion; thymus.


Conflict of interest statement

The authors declare no conflict of interest.

Figures

Fig. 1.
Fig. 1.
Reduced number of iNKT cells in 2A3-D Tg mice. (A) Total thymocytes from C57BL/6 or 2A3-D Tg mice were stained for indicated markers to characterize specific stages of T-cell development (data representative of n = 3). (B) Total lymphocytes from indicated organs of C57BL/6, 2A3-D Tg or 2A3-D Tg TCR-α+/− mice were assessed for the presence of iNKT cells (data representative of n = 10). (C) Mean absolute numbers ± SEM of PBS57-CD1d tetramer-positive TCR-β+ iNKT cells were calculated for the thymus, spleen, and liver of C57BL/6 (●) and 2A3-D Tg (○) mice. Each dot represents a mouse (n = 10). ***P < 0.001.
Fig. 2.
Fig. 2.
iNKT cell development in 2A3-D Tg mice. (A) The gating strategy to identify the various iNKT cell developmental stages is depicted. Total thymocytes were MACS bead-enriched for the PBS57-CD1d tetramer-positive population and then stained for CD24, CD44, and NK1.1 to characterize the developmental stages of iNKT cells. The stages are defined as follows: stage 0 (CD24+CD44NK1.1), stage 1 (CD24CD44NK1.1), stage 2 (CD24CD44+NK1.1), and stage 3 (CD24CD44+NK1.1+) (data representative of n = 4). (B) Mean absolute numbers ± SEM of PBS57-CD1d tetramer-positive TCR-β+ NKT cell developmental stages were calculated in the thymus of C57BL/6 (●) and 2A3-D Tg (white dot) mice. Absolute numbers were calculated using population percentages from samples that were not subjected to MACS-enrichment. In these instances, large numbers of events were collected to clearly define the different populations. Each dot represents an independent mouse (n = 8). (C and D) Purified lymphocytes from the spleen (C) or the liver (D) of C57BL/6 or 2A3-D Tg mice were stained for CD44 and NK1.1. Mean absolute numbers ± SEM of iNKT cell maturation stages in the spleen (C) or liver (D) of C57BL/6 (black dot) and 2A3-D Tg (white dot) mice. Each dot represents a mouse (n = 8). Ns, not significant, **P < 0.01, and ***P < 0.001.
Fig. 3.
Fig. 3.
iNKT cells are redistributed in the pLN of 2A3-D Tg mice. (A) Lymphocytes from peripheral lymph nodes (pLN) were pooled and stained for CD44, NK1.1, and CD62L to characterize iNKT cells. Histogram legend: isotype (gray filled), C57BL/6 (black filled) and 2A3-D Tg (black line) (data representative of n = 8 and histogram representative of n = 3). (B) Mean absolute numbers ± SEM of the different phenotypic PBS57-CD1d tetramer-positive TCR-β+ NKT cell populations in the pLN of C57BL/6 (black dot) and 2A3-D Tg (white dot) mice. Each dot represents a mouse (n = 8). ***P < 0.001.
Fig. 4.
Fig. 4.
iNKT cells in the 2A3-D Tg mice are poorly responsive. C57BL/6 and 2A3-D Tg mice received an intraperitoneal injection of 2 μg of αGC or PBS. (A) Serum was collected at 4 h and 12 h after injection to quantify by ELISA IL-4 and IFN-γ concentration, respectively (n = 3). (B) Ninety minutes after injection, mice were killed and purified splenocytes were stained for PBS57-CD1d tetramer-positive TCR-β+ NKT cells and for intracellular IL-4 and IFN-γ (data representative of n = 3). ***P < 0.001.
Fig. 5.
Fig. 5.
TCR-α repertoire of iNKT cells in the periphery of 2A3-D Tg mice. Splenocytes from C57BL/6 and 2A3-D Tg mice were MACS bead-enriched for PBS57-CD1d tetramer-positive cells and PBS57-CD1d tetramer-positive TCR-β+ iNKT cells were subsequently FACS sorted from the positive fraction. (A) Vα14-Cα PCR products were sequenced using the 454 platform and the frequency use of T-cell receptor-α joining (TRAJ) genes encoding productive rearrangements with T-cell receptor alpha variable gene (TRAV) TRAV11 is shown (data representative of n = 2). The TRAJ number, from 58 to 2, follow the order that the genes are found in the TCR-α locus. (B) Frequency and CDR3 size (in amino acids) of the Vα14-Jα18 rearrangements in C57BL/6 or 2A3-D Tg iNKT splenocytes (data representative of n = 2). The canonical D94 rearrangement is depicted in blue and the A94 variant sequence is depicted in red. Other sequences (i.e., other 94 variants as well as other position variants) are depicted in black.
Fig. 6.
Fig. 6.
Tracking of TCR-α repertoire during iNKT cell development in the thymus. DP CD4+CD8+CD69 PBS57-CD1d tetramer-negative thymocytes were FACS-sorted from C57BL/6 (A) or 2A3-D Tg mice (B) (first row). Alternatively, thymocytes from C57BL/6 (A) and 2A3-D Tg (B) mice were MACS bead-enriched for PBS57-CD1d tetramer-positive cells and the different iNKT cell developmental stages were FACS-sorted based on CD24 and CD44 staining. Stage 0 (PBS57-CD1d+CD24+CD44, second row), stage 1 (PBS57-CD1d+CD24CD44, third row), and stage 2/3 (PBS57-CD1d+CD24CD44+, fourth row). Vα14 rearrangements were amplified by PCR from each population using Vα14- and Cα-specific primers and the Vα14-Cα PCR products were sequenced using the 454 platform. The frequency use of TRAJ genes encoding productive rearrangements with TRAV11 in the indicated sorted population is depicted. The experiment was repeated twice for the DP thymocytes and the individual results are depicted in black and red, respectively. The number of total sequence analyzed for each sample is indicated. Furthermore, the frequency and CDR3 sizes of the Vα14-Jα18 rearrangements for each targeted population are shown. The canonical D94 rearrangement is depicted in blue and the A94 variant sequence is depicted in red. The N94 variant is shown in yellow, the E94 variant in dark purple, and the S94 in pink). Other sequences (i.e., other 94 variants as well as other position variants and CDR3 sizes) are depicted in black.
Fig. 7.
Fig. 7.
Natural variants at position 94 of the canonical iNKT CDR3α have a lower affinity for self. (A) Binding of iNKT TCR variants to lipid loaded CD1d as assessed by SPR. Saturation plots demonstrating equilibrium binding of Vβ 2A3-D–Vα14 D94 TCR and the Vβ 2A3-D–Vα14 A94 TCR to immobilized CD1d-iGb3 and CD1d-PI. Affinities (Kd) were calculated from two independent experiments using BIAevaluation software. For visualization, datapoints from duplicates of a single experiment were plotted as the mean ± SEM and curves were fitted to a one-site model using Prism. (B) Sensograms showing the binding of 5 μM Vβ 2A3-D–Vα14 D94 or Vβ 2A3-D–Vα14 A94 to immobilized CD1d-α-GC.
Fig. 8.
Fig. 8.
iNKT TCR affinity affects the developmental program of iNKT cells. (A) Total thymocytes were MACS bead-enriched for PBS57-CD1d+ population and then stained for CD24, CD44, and NK1.1 to characterize the developmental stages of iNKT cells. The stages are defined as follows: stage 0 (CD24highCD44lowNK1.1low), stage 1 (CD24lowCD44lowNK1.1low), stage 2 (CD24lowCD44highNK1.1low), and stage 3 (CD24lowCD44highNK1.1high) (data representative of n = 4). Five thymi were pooled for each staining, enriched for PBS57-CD1d+ cells, and further stained for iNKT cell developmental stages and Egr-2. The histogram show representative Egr-2 gMFI (geometric mean flouorescent intensity) for each stages as defined in A for C57BL/6 and 2A3-D Tg mice (data representative of n = 2). (B) Plot presenting the Egr-2 gMFI results from two independent experiments for a total of four independent stainings. Each dot represents five pooled thymi. (C) Five thymi were pooled for each staining, enriched for PBS57-CD1d+ cells and further stained for iNKT cell developmental stages and PLZF. (D) Plot presenting PLZF gMFI results for each stage from one experiment with three independent samples from C57BL/6 and 2A3-D Tg mice. (E) C57BL/6 and 2A3-D Tg mice received daily intraperitoneal injection of 1 mg BrdU for 3 d. Mice were killed and thymocytes were MACS bead-enriched for PBS57-CD1d+ population. BrdU incorporation was assessed by intracellular staining (data representative of n = 3). (F) Plot presenting the percentage of BrdU incorporation according to stages described in A for C57BL/6 and 2A3-D Tg mice (n = 3). *P < 0.05, **P < 0.01, and ***P < 0.001.

References

    1. Bendelac A, Savage PB, Teyton L. The biology of NKT cells. Annu Rev Immunol. 2007;25:297–336. - PubMed
    1. Kronenberg M. Toward an understanding of NKT cell biology: Progress and paradoxes. Annu Rev Immunol. 2005;23:877–900. - PubMed
    1. Brennan PJ, Brigl M, Brenner MB. Invariant natural killer T cells: An innate activation scheme linked to diverse effector functions. Nat Rev Immunol. 2013;13(2):101–117. - PubMed
    1. Matsuda JL, Mallevaey T, Scott-Browne J, Gapin L. CD1d-restricted iNKT cells, the ‘Swiss-Army knife’ of the immune system. Curr Opin Immunol. 2008;20(3):358–368. - PMC - PubMed
    1. Uldrich AP, et al. A semi-invariant Vα10+ T cell antigen receptor defines a population of natural killer T cells with distinct glycolipid antigen-recognition properties. Nat Immunol. 2011;12(7):616–623. - PMC - PubMed

Publication types

MeSH terms

Substances

LinkOut - more resources