. 2014 Jan 7;111(1):131-6.
doi: 10.1073/pnas.1311970111. Epub 2013 Dec 16.

Rewiring yeast sugar transporter preference through modifying a conserved protein motif

Affiliations

Rewiring yeast sugar transporter preference through modifying a conserved protein motif

Eric M Young et al. Proc Natl Acad Sci U S A. .

Abstract

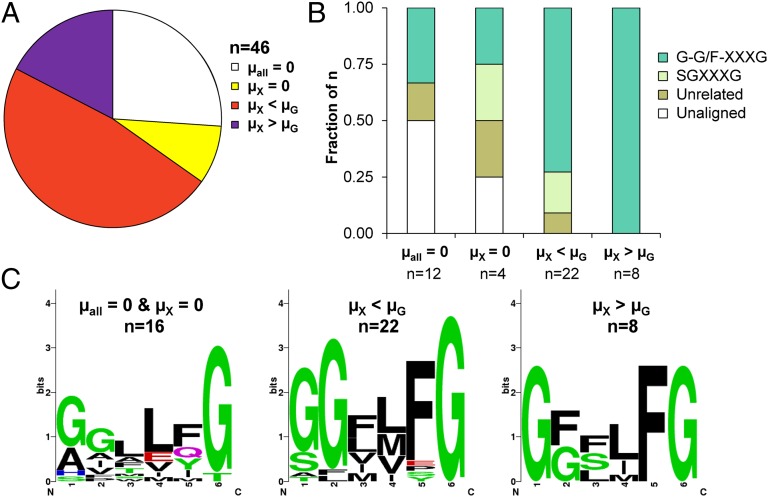
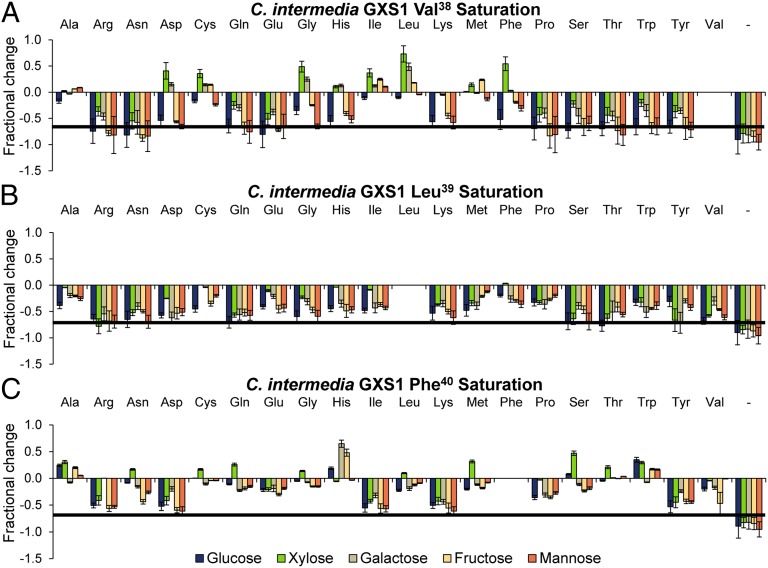
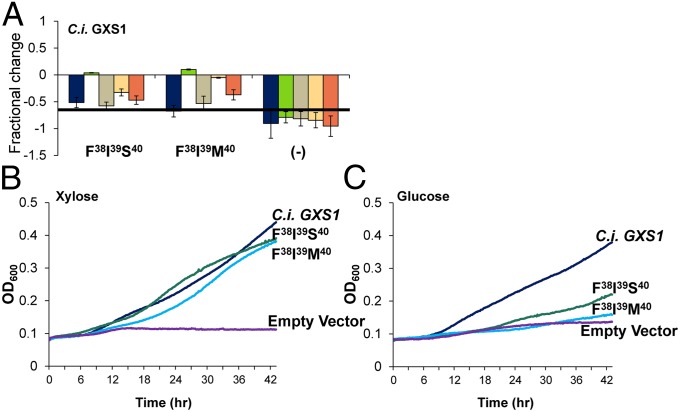
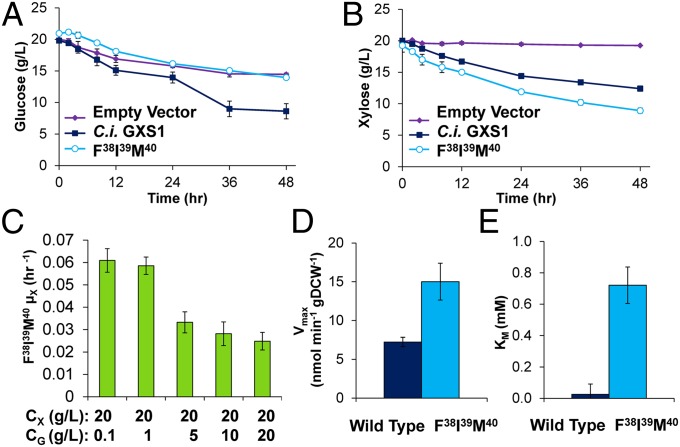
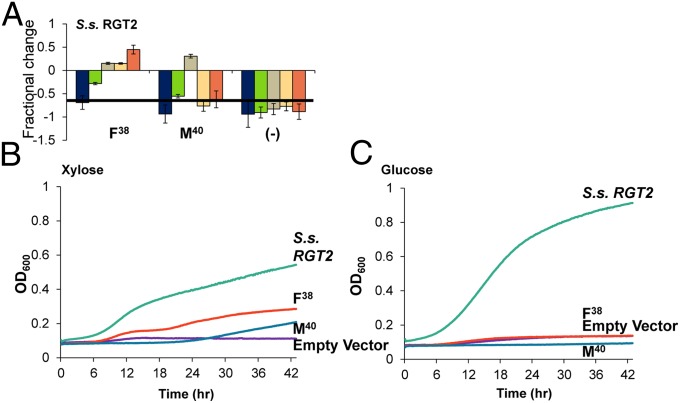
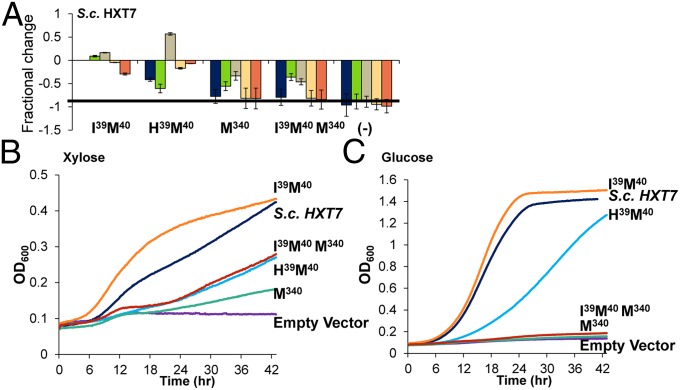
Utilization of exogenous sugars found in lignocellulosic biomass hydrolysates, such as xylose, must be improved before yeast can serve as an efficient biofuel and biochemical production platform. In particular, the first step in this process, the molecular transport of xylose into the cell, can serve as a significant flux bottleneck and is highly inhibited by other sugars. Here we demonstrate that sugar transport preference and kinetics can be rewired through the programming of a sequence motif of the general form G-G/F-XXX-G found in the first transmembrane span. By evaluating 46 different heterologously expressed transporters, we find that this motif is conserved among functional transporters and highly enriched in transporters that confer growth on xylose. Through saturation mutagenesis and subsequent rational mutagenesis, four transporter mutants unable to confer growth on glucose but able to sustain growth on xylose were engineered. Specifically, Candida intermedia gxs1 Phe(38)Ile(39)Met(40), Scheffersomyces stipitis rgt2 Phe(38) and Met(40), and Saccharomyces cerevisiae hxt7 Ile(39)Met(40)Met(340) all exhibit this phenotype. In these cases, primary hexose transporters were rewired into xylose transporters. These xylose transporters nevertheless remained inhibited by glucose. Furthermore, in the course of identifying this motif, novel wild-type transporters with superior monosaccharide growth profiles were discovered, namely S. stipitis RGT2 and Debaryomyces hansenii 2D01474. These findings build toward the engineering of efficient pentose utilization in yeast and provide a blueprint for reprogramming transporter properties.

Keywords: metabolic engineering; protein engineering; transporter engineering; xylose metabolism.


Conflict of interest statement

The authors declare no conflict of interest.

Figures

Fig. 1.
Fig. 1.
Sequence categorization and phenotypic classification of native and heterologous transporters. (A) The distribution of phenotypic classes for all 46 transporters. (B) The distribution of each sequence category present in each phenotypic class. Transporters containing the conserved motif are enriched in the phenotypic classes that confer growth on xylose. (C) Weblogos of the phenotypic classes illustrate enrichment of the G-G/F-XXXG motif in TMS1. µall = 0 represents no growth in the five carbon sources tested; µX = 0 represents growth on hexoses but not xylose, µX < µG represents growth on xylose is less than that on glucose, and µX > µG represents growth on xylose is greater than that on glucose.
Fig. 2.
Fig. 2.
Classification tree of fractional change in carbon source growth profile. This figure depicts hypothetical fractional change data to demonstrate how these phenotypes were classified. Little fractional change across all sugars indicates that the substitution does not control efficiency or selectivity in this background. Amplification or attenuation of growth rates across all carbon sources indicates an efficiency substitution. Amplification of growth on one sugar, ideally xylose, and attenuation of all others indicates a selectivity substitution.
Fig. 3.
Fig. 3.
Fractional change of saturation mutagenesis libraries of C. intermedia GXS1. Fractional change in growth by substitutions at positions 38 (A), 39 (B), and 40 (C). The solid line is the confidence line for no growth based on the negative control sample. (AC) Error bars were calculated using the sum of least squares method.
Fig. 4.
Fig. 4.
Growth characterization of C. intermedia gxs1 triple mutants. (A) Fractional change from wild type for the two triple mutants and an empty vector control. A bar chart of the exponential growth rates from which fractional change was calculated can be found in SI Appendix. Error bars were calculated using the sum of least squares method. (B) Average growth curves on xylose based on OD600. (C) Average growth curves on glucose based on OD600. Calculated exponential growth rates are shown in SI Appendix, Fig. S7.
Fig. 5.
Fig. 5.
Further characterization of C. intermedia gxs1 Phe38Ile39Met40 triple mutant. (A) Glucose uptake at high cell density for S. cerevisiae EX.12 expressing wild type, Phe38Ile39Met40, and empty vector. (B) Xylose uptake at high cell density for S. cerevisiae EX.12 expressing wild type, Phe38Ile39Met40, and empty vector. (C) Inhibition of the growth rate on xylose with increasing glucose concentration. (D) Vmax of both the wild type and the mutant. (E) KM of both the wild type and triple mutant. (AE) Error is based on SD of biological replicates.
Fig. 6.
Fig. 6.
Growth characterization of S. stipitis RGT2 and mutants. (A) Fractional change from wild type for the two single mutants and an empty vector control. Error bars were calculated using the sum of least squares method. A bar chart of the exponential growth rates from which fractional change was calculated can be found in SI Appendix. (B) Average growth curves on xylose based on OD600. (C) Average growth curves on glucose based on OD600. Calculated maximum exponential growth rates are shown in SI Appendix, Fig. S7.
Fig. 7.
Fig. 7.
Growth characterization of S. cerevisiae HXT7 and mutants. (A) Fractional change from wild type for the mutants and an empty vector control. Error bars were calculated using the sum of least squares method. A bar chart of the exponential growth rates from which fractional change was calculated can be found in SI Appendix. (B) Average growth curves on xylose based on OD600. (C) Average growth curves on glucose based on OD600. Calculated maximum exponential growth rates are shown in SI Appendix, Fig. S7.

References

    1. Reijenga KA, et al. Control of glycolytic dynamics by hexose transport in Saccharomyces cerevisiae. Biophys J. 2001;80(2):626–634. - PMC - PubMed
    1. Gárdonyi M, Jeppsson M, Lidén G, Gorwa-Grauslund MF, Hahn-Hägerdal B. Control of xylose consumption by xylose transport in recombinant Saccharomyces cerevisiae. Biotechnol Bioeng. 2003;82(7):818–824. - PubMed
    1. Elbing K, et al. Role of hexose transport in control of glycolytic flux in Saccharomyces cerevisiae. Appl Environ Microbiol. 2004;70(9):5323–5330. - PMC - PubMed
    1. Wahlbom CF, Cordero Otero RR, van Zyl WH, Hahn-Hägerdal B, Jönsson LJ. Molecular analysis of a Saccharomyces cerevisiae mutant with improved ability to utilize xylose shows enhanced expression of proteins involved in transport, initial xylose metabolism, and the pentose phosphate pathway. Appl Environ Microbiol. 2003;69(2):740–746. - PMC - PubMed
    1. Bengtsson O, et al. Identification of common traits in improved xylose-growing Saccharomyces cerevisiae for inverse metabolic engineering. Yeast. 2008;25(11):835–847. - PubMed

Publication types