. 2014 Mar 4;111(9):3239-44.
doi: 10.1073/pnas.1222474110. Epub 2013 Dec 16.

Constraints and potentials of future irrigation water availability on agricultural production under climate change

Affiliations

Constraints and potentials of future irrigation water availability on agricultural production under climate change

Joshua Elliott et al. Proc Natl Acad Sci U S A. .

Abstract

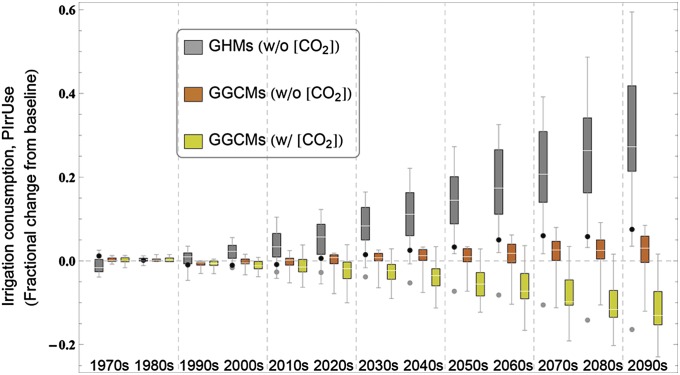
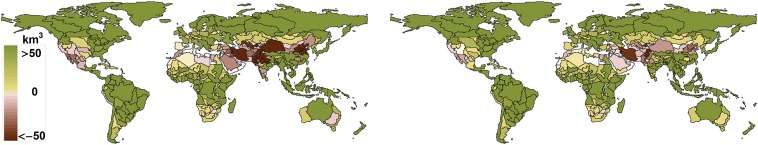
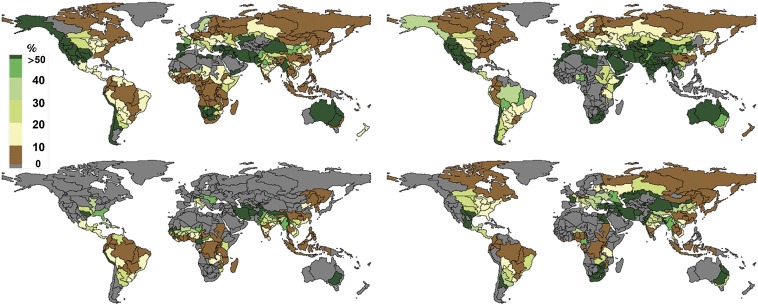
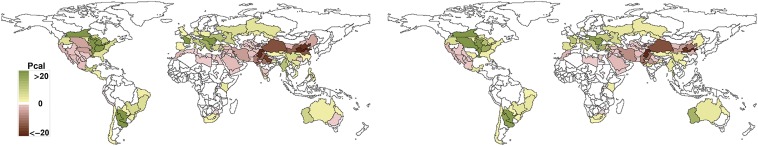
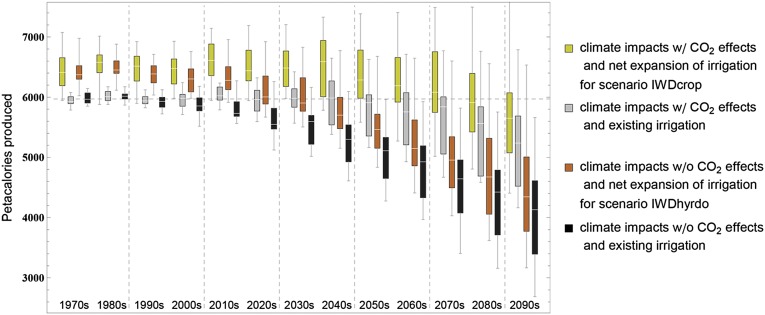
We compare ensembles of water supply and demand projections from 10 global hydrological models and six global gridded crop models. These are produced as part of the Inter-Sectoral Impacts Model Intercomparison Project, with coordination from the Agricultural Model Intercomparison and Improvement Project, and driven by outputs of general circulation models run under representative concentration pathway 8.5 as part of the Fifth Coupled Model Intercomparison Project. Models project that direct climate impacts to maize, soybean, wheat, and rice involve losses of 400-1,400 Pcal (8-24% of present-day total) when CO2 fertilization effects are accounted for or 1,400-2,600 Pcal (24-43%) otherwise. Freshwater limitations in some irrigated regions (western United States; China; and West, South, and Central Asia) could necessitate the reversion of 20-60 Mha of cropland from irrigated to rainfed management by end-of-century, and a further loss of 600-2,900 Pcal of food production. In other regions (northern/eastern United States, parts of South America, much of Europe, and South East Asia) surplus water supply could in principle support a net increase in irrigation, although substantial investments in irrigation infrastructure would be required.

Keywords: adaptation; agriculture; hydrology; uncertainty.


Conflict of interest statement

The authors declare no conflict of interest.

Figures

Fig. 1.
Fig. 1.
Comparison of fractional change relative to the model specific average 1980–2010 baseline of projections of total global PIrrUse in RCP 8.5 from all GCM × GHM combination and all GCM × GGCM combination with and without the effects of increasing [CO2]. Results from LPJmL (mean over all GCMs) with (gray dots) and without (black dots) increasing [CO2] are shown explicitly. LPJmL is unique in that it falls into both GHM and GGCM categories and is unique among the GHMs in that it provides estimates for PIrrUse both with and without the effects of increasing [CO2].
Fig. 2.
Fig. 2.
Median potential end-of-century renewable water abundance/deficiency in average cubic kilometers per year under RCP 8.5 for (Left) all GCM × GHM combinations (IWDhydro scenario) for both supply and demand and (Right) using all GCM × GGCM combinations for irrigation demands (IWDcrop scenario). Positive values indicate areas with irrigation adaptation potential and negative values indicate irrigation constrained areas. Dark green FPUs are saturated at 50 km3/y.
Fig. 3.
Fig. 3.
Median potential per hectare increase in maize (Upper Left), wheat (Upper Right), soybean (Lower Right), and rice (Lower Left) yields at the end-of-century from irrigation applied on what are currently rainfed areas for scenarios with the effects of increasing atmospheric CO2 concentrations included. Maps show median values across all 30 GCM × GGCM combinations in the ensemble for RCP 8.5.
Fig. 4.
Fig. 4.
Potential change in total production of maize, soybean, wheat, and rice at end-of-century given maximal use of available water for increased/decreased irrigation use on what are currently rainfed/irrigated areas in total calories. (Left) Median of 156 GCM × GHM × GGCM combinations for scenarios constructed using GHM estimates of present-day irrigation demand. (Right) Median of 202 GCM × GHM × GGCM combinations for scenarios constructed using GGCM estimates of present-day irrigation demand.
Fig. 5.
Fig. 5.
Comparison of the total annual global calories of maize, soybean, wheat, and rice for RCP 8.5 as projected by four sets of ensemble simulations. The first two sets assume no change in irrigated areas and consist of (i) 30 GCM × GGCM combinations with CO2 effects and (ii) 22 GCM × GGCM combinations without CO2 effects. The second two sets consist of (iii) 202 GCM × GHM × GGCM combinations with CO2 effects and a global net expansion in irrigated areas according to the IWDcrop scenario, and (iv) 156 GCM × GHM × GGCM combinations without CO2 effects and a global net expansion in irrigated areas according to the IWDhydro scenario.

References

    1. United Nations (2008) United Nations, World Population Prospects: The 2008 Revision Population Database (United Nations Publications, New York) No. 200.
    1. Edgerton MD. Increasing crop productivity to meet global needs for feed, food, and fuel. Plant Physiol. 2009;149(1):7–13. - PMC - PubMed
    1. Pimentel D, Pimentel M. Sustainability of meat-based and plant-based diets and the environment. Am J Clin Nutr. 2003;78(3) Suppl:660S–663S. - PubMed
    1. US Department of Agriculture (2009) Summary Report: 2007 National Resources Inventory (Natural Resources Conservation Service, Washington, DC, and Center for Survey Statistics and Methodology, Iowa State University, Ames, Iowa)
    1. de Fraiture C. Integrated water and food analysis at the global and basin level. An application of WATERSIM. Water Resour Manage. 2007;21(1):185–198.

Publication types

LinkOut - more resources