

Assessing agricultural risks of climate change in the 21st century in a global gridded crop model intercomparison
- PMID: 24344314
- PMCID: PMC3948251
- DOI: 10.1073/pnas.1222463110
Assessing agricultural risks of climate change in the 21st century in a global gridded crop model intercomparison
Erratum in
-
Correction to Supporting Information for Rosenzweig et al., Assessing agricultural risks of climate change in the 21st century in a global gridded crop model intercomparison.Proc Natl Acad Sci U S A. 2016 Feb 2;113(5):E665. doi: 10.1073/pnas.1600146113. Epub 2016 Jan 25. Proc Natl Acad Sci U S A. 2016. PMID: 26811461 Free PMC article. No abstract available.
Abstract
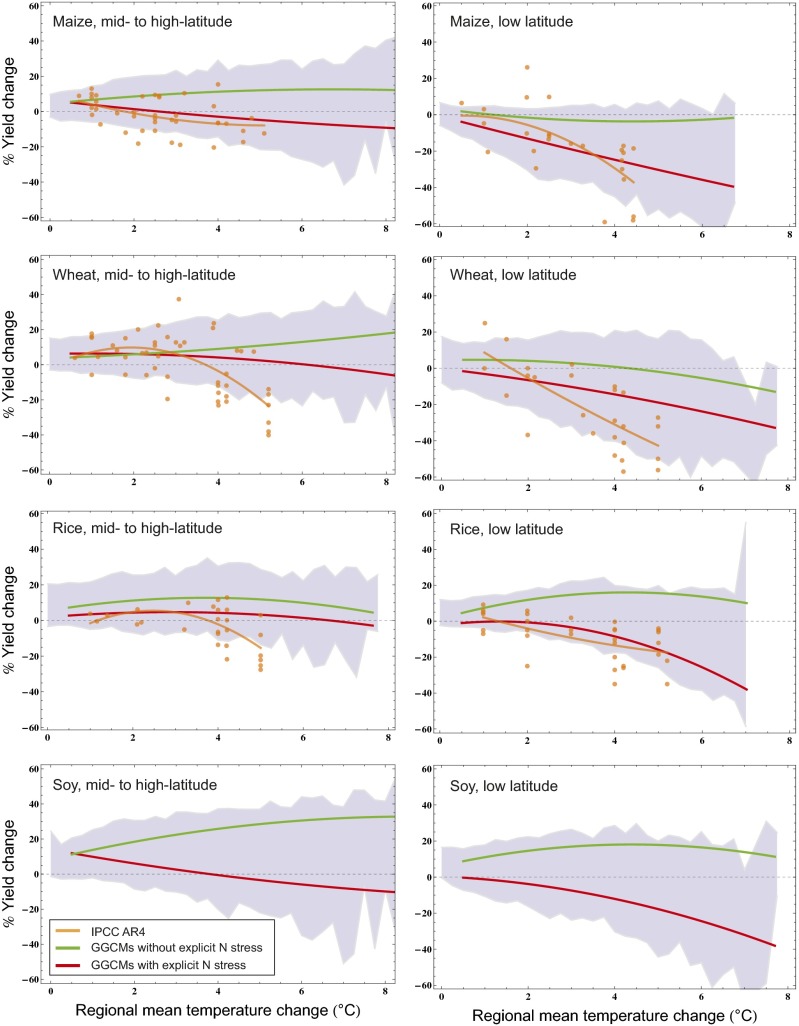
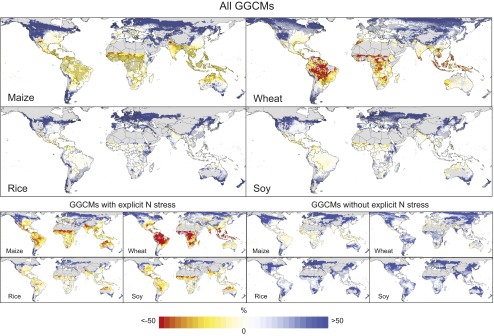
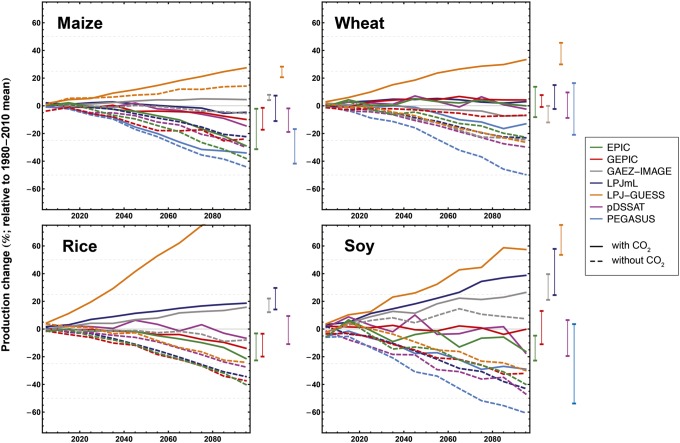
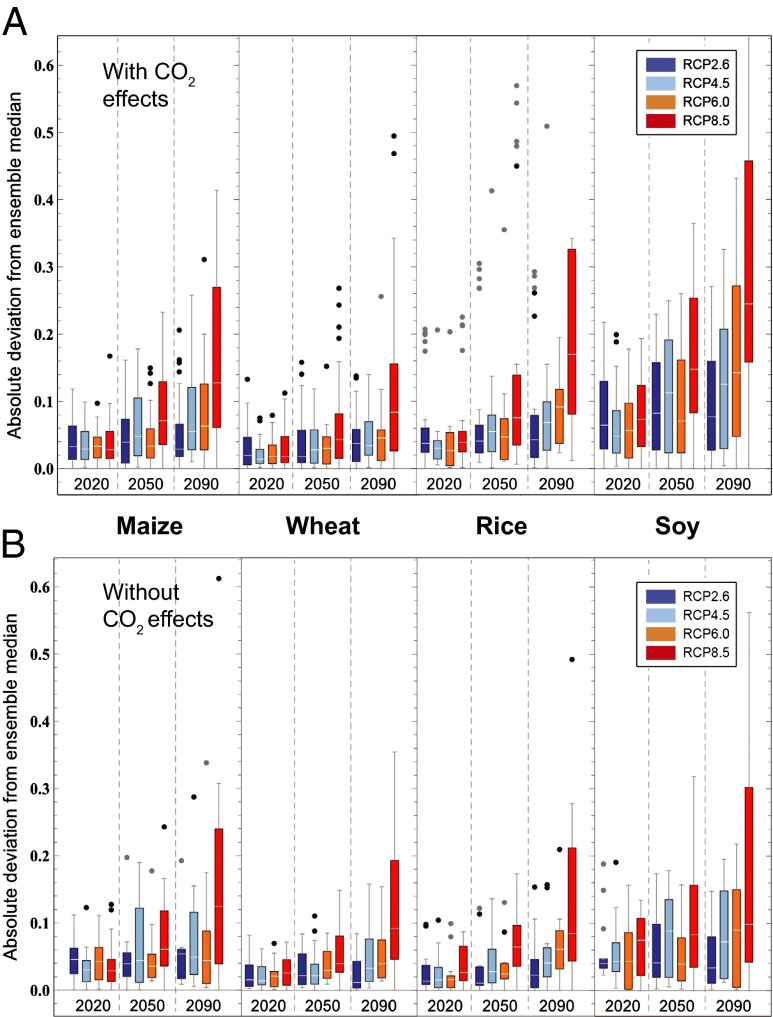
Here we present the results from an intercomparison of multiple global gridded crop models (GGCMs) within the framework of the Agricultural Model Intercomparison and Improvement Project and the Inter-Sectoral Impacts Model Intercomparison Project. Results indicate strong negative effects of climate change, especially at higher levels of warming and at low latitudes; models that include explicit nitrogen stress project more severe impacts. Across seven GGCMs, five global climate models, and four representative concentration pathways, model agreement on direction of yield changes is found in many major agricultural regions at both low and high latitudes; however, reducing uncertainty in sign of response in mid-latitude regions remains a challenge. Uncertainties related to the representation of carbon dioxide, nitrogen, and high temperature effects demonstrated here show that further research is urgently needed to better understand effects of climate change on agricultural production and to devise targeted adaptation strategies.
Keywords: AgMIP; ISI-MIP; agriculture; climate impacts; food security.
Conflict of interest statement
The authors declare no conflict of interest.
Figures
References
-
- Brisson N, et al. An overview of the crop model STICS. Eur J Agron. 2003;18(3-4):309–332.
-
- Jones JW, et al. Use of crop models for climate-agricultural decisions. In: Hillel D, Rosenzweig C, editors. Handbook of Climate Change and Agroecosystems. ICP Series on Climate Change Impacts, Adaptation, and Mitigation. Vol 1. London: Imperial College Press; 2011. pp. 131–157.
-
- Keating BA, et al. An overview of APSIM, a model designed for farming systems simulation. Eur J Agron. 2003;18(3-4):267–288.
-
- van Ittersum MK, Donatelli M. Modeling cropping systems: Science, software and applications. Eur J Agron. 2003;16:309–332.
-
- Challinor AJ, Wheeler TR, Craufurd PQ, Slingo JM, Grimes DLF. Design and optimization of a large-area process-based model for annual crops. Agr For Meteorol. 2004;124:99–120.
Publication types
MeSH terms
Substances
LinkOut - more resources
Full Text Sources
Other Literature Sources
Medical
