Case Reports
. 2014 Jun;26(6):1266-82.
doi: 10.1162/jocn_a_00538. Epub 2013 Dec 17.

Reorganization of retinotopic maps after occipital lobe infarction

Affiliations
Case Reports

Reorganization of retinotopic maps after occipital lobe infarction

Lucia M Vaina et al. J Cogn Neurosci. 2014 Jun.

Abstract

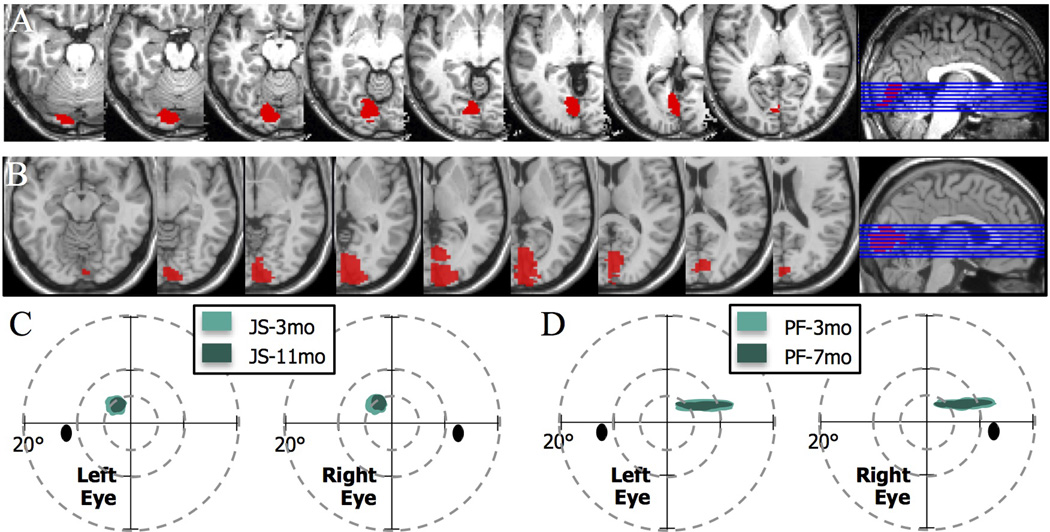
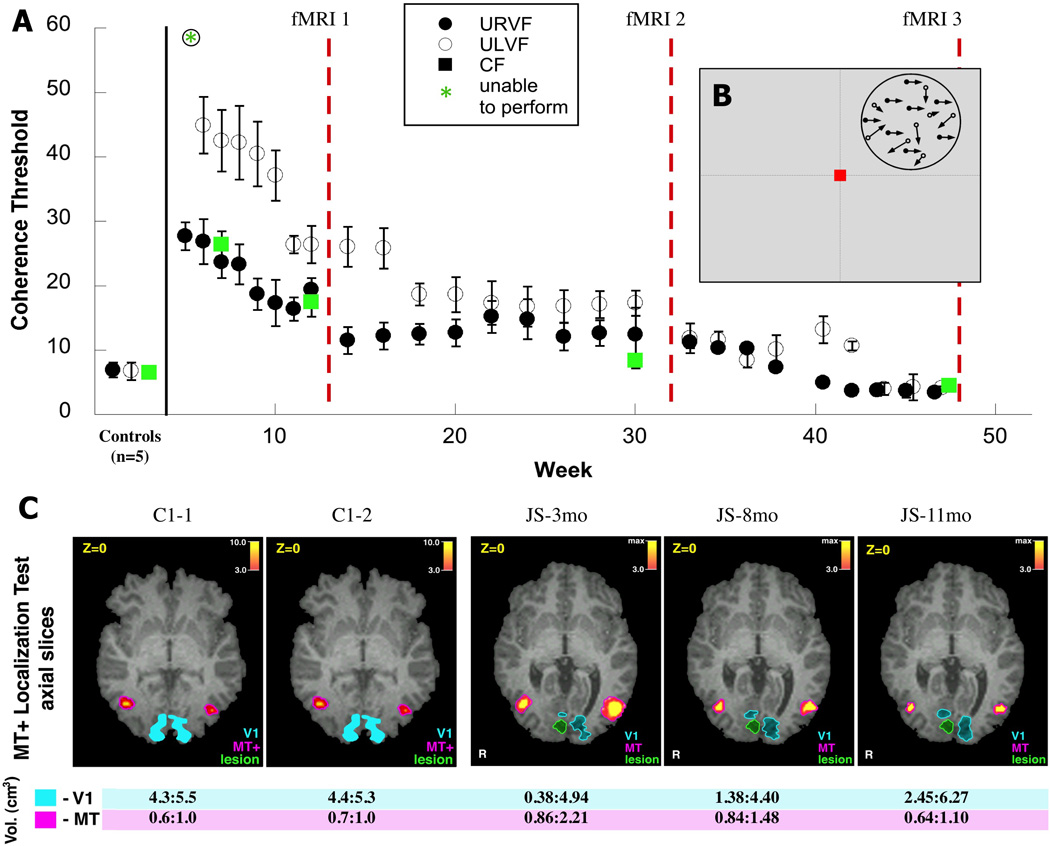
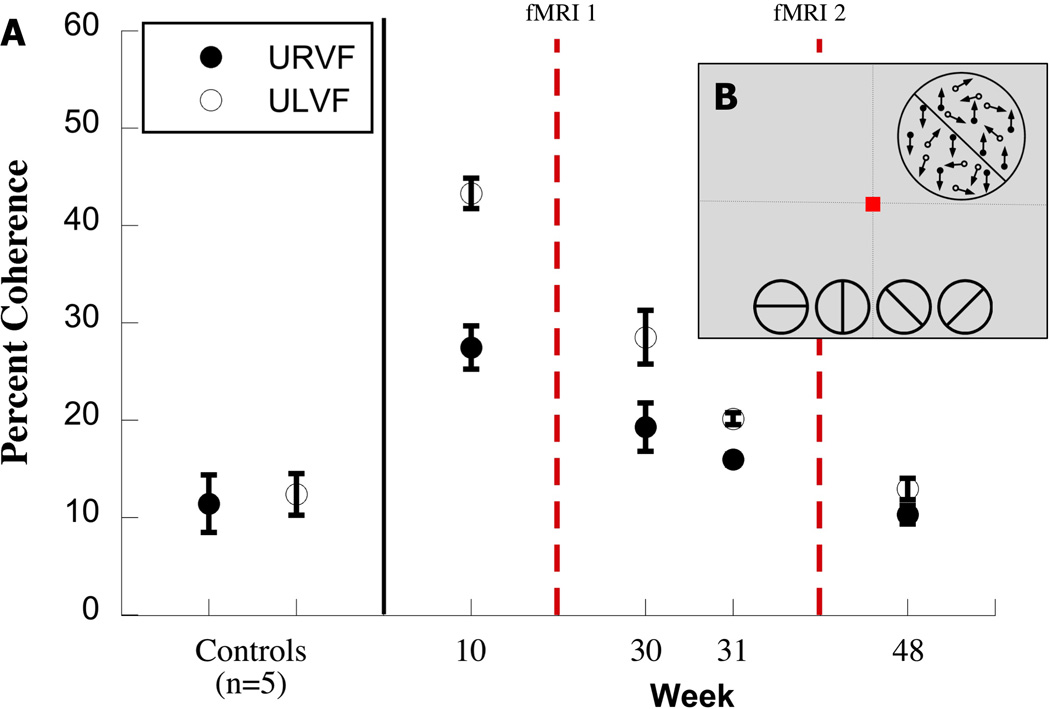
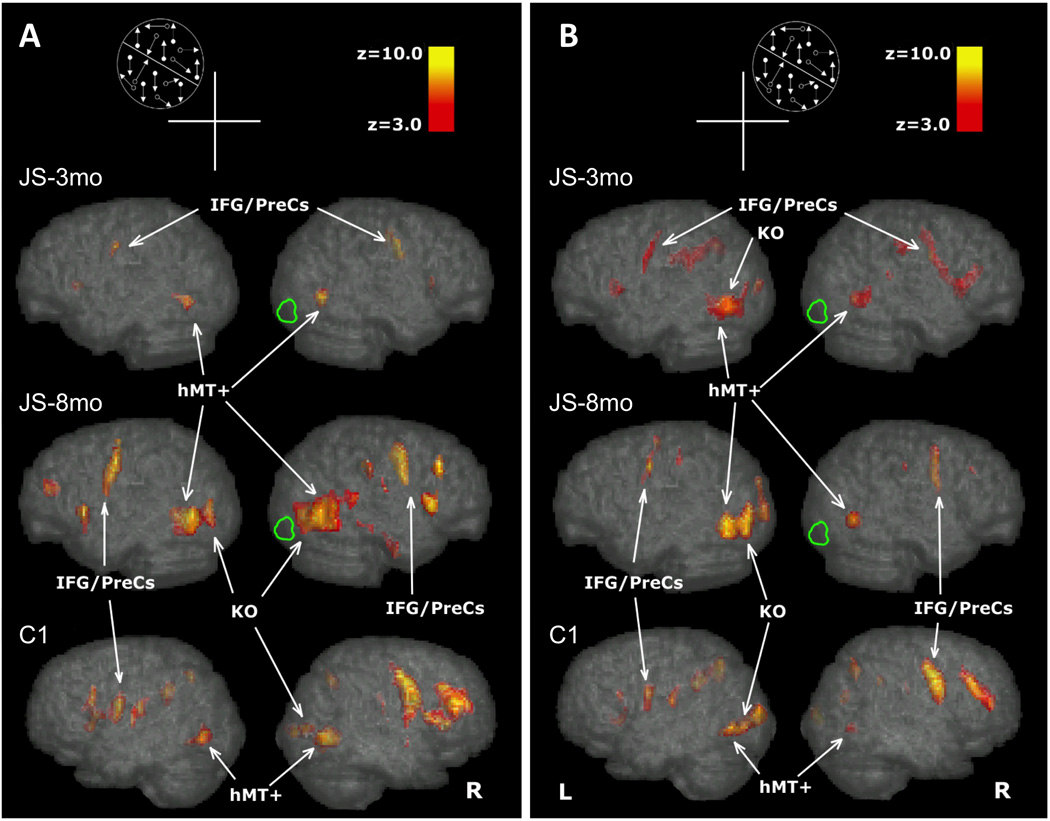
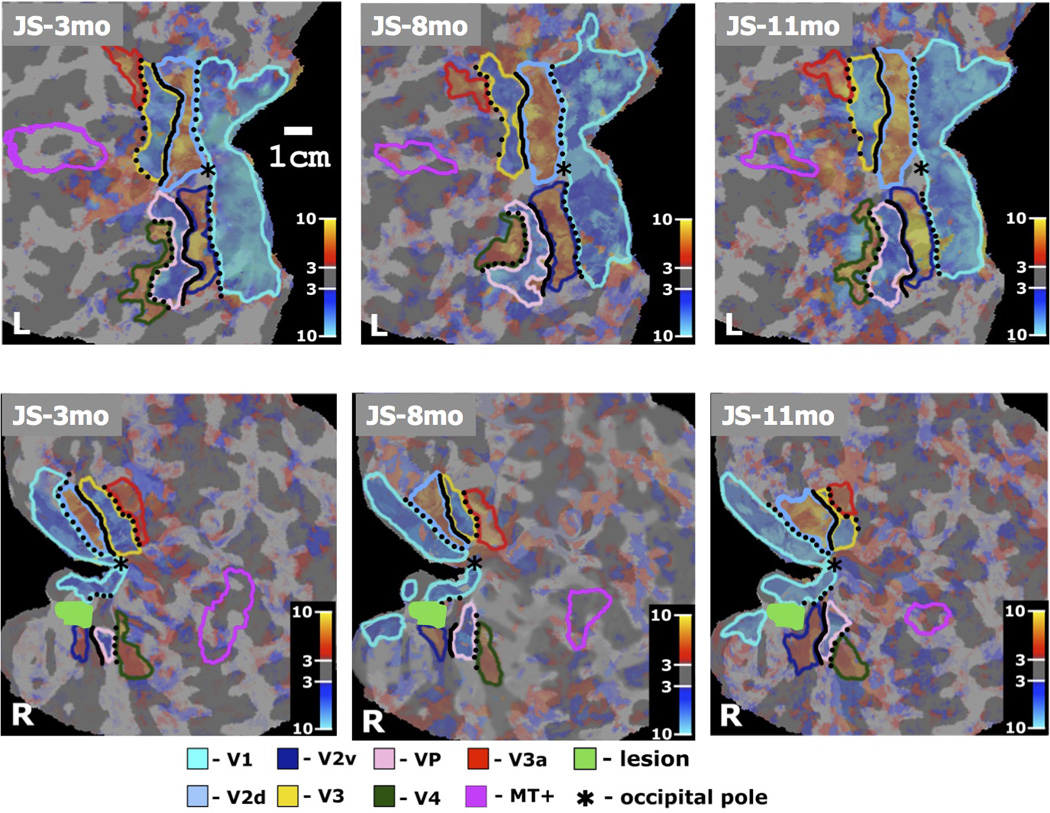
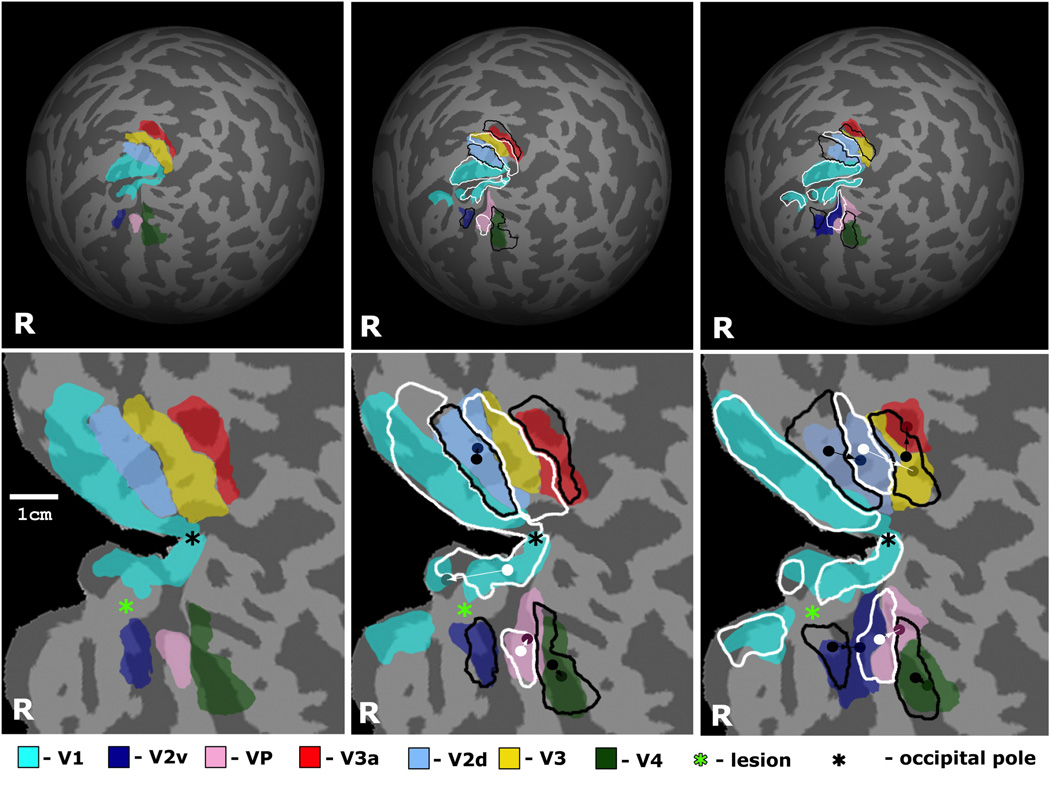
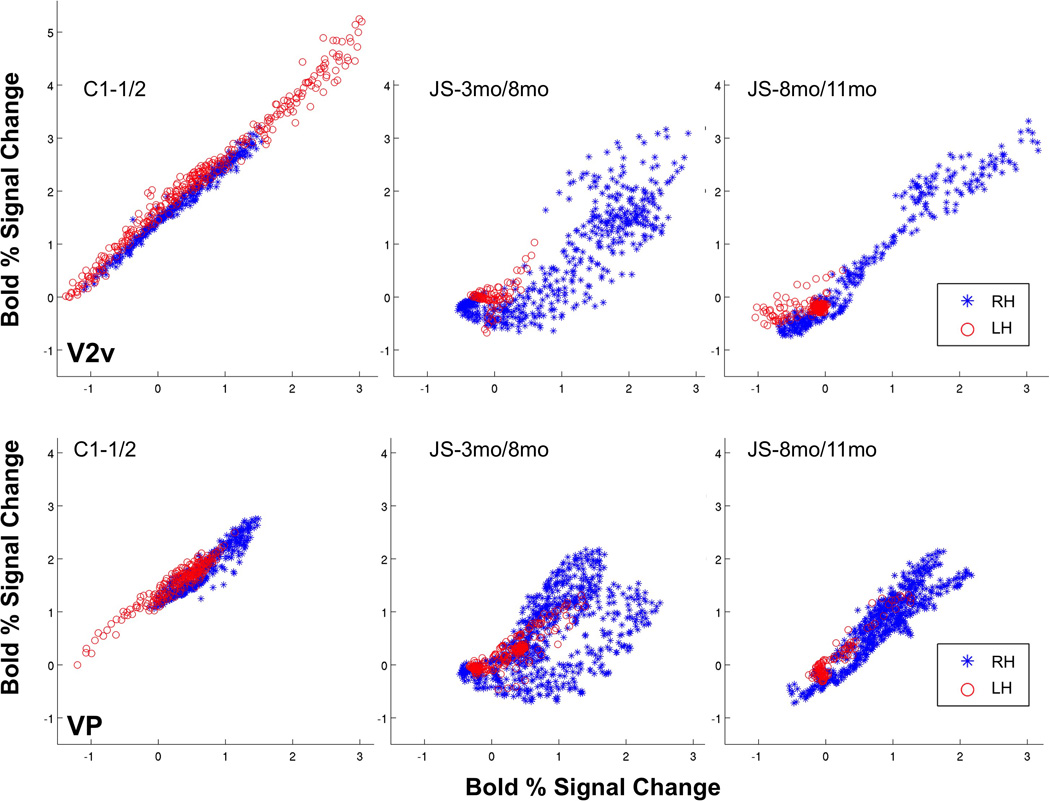
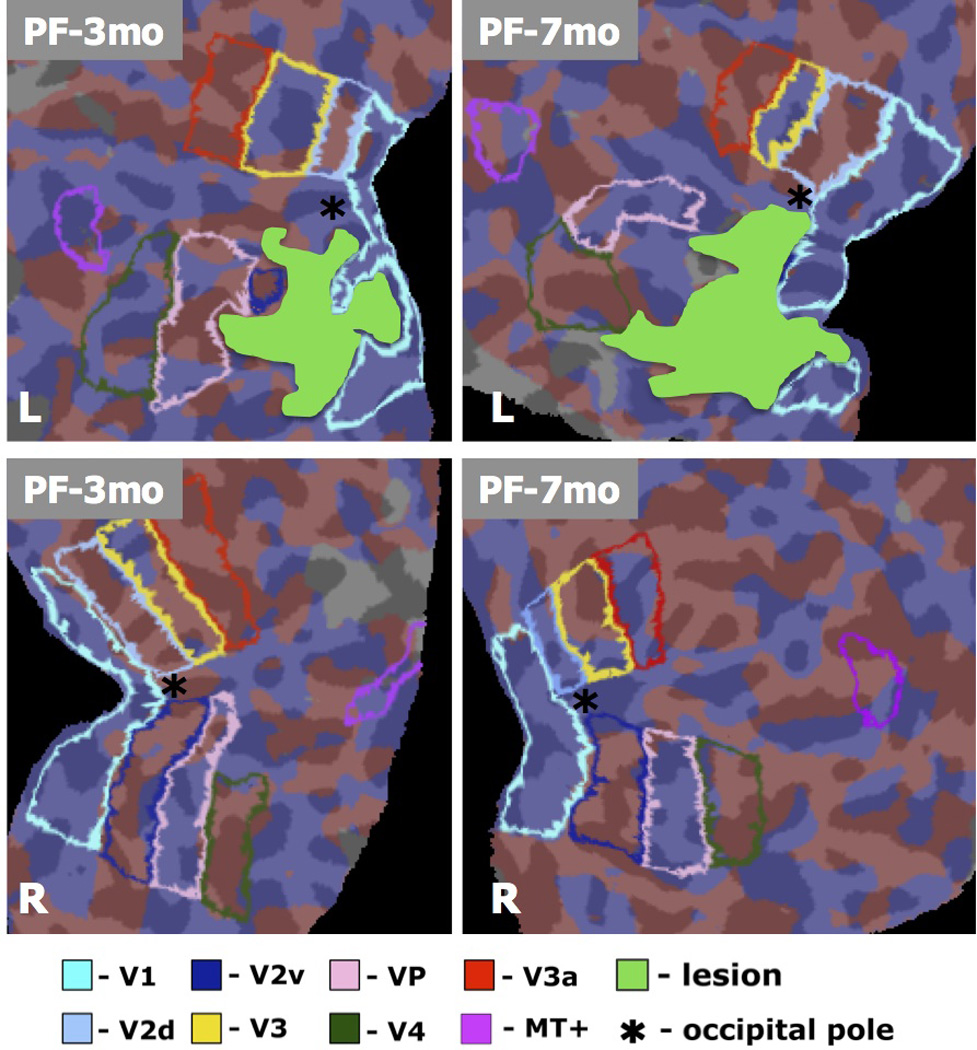
We studied patient JS, who had a right occipital infarct that encroached on visual areas V1, V2v, and VP. When tested psychophysically, he was very impaired at detecting the direction of motion in random dot displays where a variable proportion of dots moving in one direction (signal) were embedded in masking motion noise (noise dots). The impairment on this motion coherence task was especially marked when the display was presented to the upper left (affected) visual quadrant, contralateral to his lesion. However, with extensive training, by 11 months his threshold fell to the level of healthy participants. Training on the motion coherence task generalized to another motion task, the motion discontinuity task, on which he had to detect the presence of an edge that was defined by the difference in the direction of the coherently moving dots (signal) within the display. He was much better at this task at 8 than 3 months, and this improvement was associated with an increase in the activation of the human MT complex (hMT(+)) and in the kinetic occipital region as shown by repeated fMRI scans. We also used fMRI to perform retinotopic mapping at 3, 8, and 11 months after the infarct. We quantified the retinotopy and areal shifts by measuring the distances between the center of mass of functionally defined areas, computed in spherical surface-based coordinates. The functionally defined retinotopic areas V1, V2v, V2d, and VP were initially smaller in the lesioned right hemisphere, but they increased in size between 3 and 11 months. This change was not found in the normal, left hemisphere of the patient or in either hemispheres of the healthy control participants. We were interested in whether practice on the motion coherence task promoted the changes in the retinotopic maps. We compared the results for patient JS with those from another patient (PF) who had a comparable lesion but had not been given such practice. We found similar changes in the maps in the lesioned hemisphere of PF. However, PF was only scanned at 3 and 7 months, and the biggest shifts in patient JS were found between 8 and 11 months. Thus, it is important to carry out a prospective study with a trained and untrained group so as to determine whether the patterns of reorganization that we have observed can be further promoted by training.


Figures

Figure 1
Figure 1. Lesion localization and visual field maps for patients JS and PF
(A,B) Axial slices of the T2 weighted image obtained in structural magnetic resonance scans (Siemens 3T) showing lesion locations, with a sagittal view indicating the positions of the slices, for (A) JS, and (B) PF. The right hemisphere infarction of Patient JS involved part of the primary visual cortex, and the immediately adjacent extrastriate areas. Patient’s PF infarct involving part of the primary visual cortex and immediately surrounding extrastriate areas in the left occipital lobe and minimally extending in the adjacent medial temporal lobe. (C,D) Schematic of Humphrey automated perimetry for mapping visual field loss. Perimetry in patient JS was obtained at 3 months and 9.5 months after the lesion and showed a paracentral upper left scotoma, initially 5 deg in diameter with the dense part of the scotoma reduced to 3.5 deg diameter at the later assessment. The field loss corresponded to a reduction in the cortical representation of the visual field (details in Supplement 1 which illustrates a progressive recovery of the visual field representation in visual cortex at 3, 8 and 11mo post-stroke). Perimetry of patient PF showed a stable visual field loss in the upper-right quadrant at 3 and 7mo post-stroke.
Figure 2
Figure 2. Learning motion coherence
(A) Performance of patient JS on the motion coherence task during training in the 11 months following his stroke. Dots show mean coherence thresholds (the proportion of signal dots necessary to perform the task) from staircases collected at the beginning of each training session +/− s.e.m. The timing of fMRI scans performed at 3, 8 and 11mo post-stroke relative training are indicated by red dotted lines. Data is shown for both upper left (open circles), upper right (closed circles) and central visual field (green squares) testing. Data is shown for all sessions prior to the 1st fMRI scan (during which JS improved rapidly), monthly between scans 1 and 2 (when performance was relatively constant), and for all sessions between scans 2 and 3 (when performance gradually approach that of healthy controls). (B) Motion coherence stimulus. A random dot field was placed in a single quadrant of the visual field. For each pair of frames, a proportion of dots (specified by the coherence) were moved translationally (e.g., displaced left/right), while the remaining dots were repositioned randomly. (C) Comparison of the size of visual areas V1 and MT+ in a control subject C1 and patient JS in fMRI scans collected over multiple sessions (2 scans, 6mo apart for C1, scans at 3, 8 and 11mo post-stroke for JS). (Top) fMRI activation maps in the MT+ localization test were projected on axial slices of the structural MRI image, locations of areas V1, MT+ and the lesion are shown in the corresponding colors. (Bottom) Size of activation (volume) of hMT+ in response to a central visual field motion coherence stimulus at each fMRI scan.
Figure 3
Figure 3. Motion Discontinuity (MDT)
The motion discontinuity stimulus is shown schematically. The display was either homogeneous (all signal dots moved up or down) or was divided along an illusory horizontal, vertical or diagonal boundary defined by signal dots on either side of it moving in opposite directions (up or down). In a 2AFC task, subjects had to identify whether the motion display was homogeneous (all signal dots moved in the same direction) or whether an illusory boundary traversing the middle of(shown along the bottom 2 alternative forced choice task). The stimuli, 6° in diameter were shown in the Upper left or right quadrant; 3B: The figure shows thresholds coherence on the MDT tasks in 5 healthy subjects and in JS. Patient JS took the task 4 times, a week before the first fMRI scanning at 3 months after the lesion, and then again twice in the week before the second fMRI on this task, and after the second fMRI. The Y axis, indicates the percent coherence, and the X axis, the weeks when Patient JS took the psychophysical task.
Figure 4
Figure 4
BOLD signal (Z>3) for the Motion Discontinuity Test displayed on the MNI brain, lateral view of the right and left hemsipheres of JS at 3 and 8 months after the lesion and a healthy control (C1-1). The location of the Motion Discontinuity stimulus, in the upper quandrant ipsilesional or contralesional is shown schematically in Figures 4A and 4B. The arrows, point to the activations in the areas MT+ and KO. Figure 4A shows the activations when the stimulus was shown in the upper left visual field quadrant. Fig 4B shows the activations when the stimulus was shown in the upper left visual field quadrant. MT+: middle temporal area (MT) and the middle superior temporal area (MST); KO: kinetic occipital region; IFG: inferior frontal gyrus; preCS: PreCentral Sulcus
Figure 5
Figure 5
Cortical representation of the tVFS maps of retinotopic visual areas V1, V2d, V2v, V3, VP, V3a, V4, and area MT+ outlined in different colors (shown in the Figure legend) and projected on the flattened representation of the cortical gray matter, separately for the left and right hemisphere. Characteristic alternation pattern of negative and positive field sign areas seen in the representation of the left hemisphere of patient JS. Abnormal retinotopy pattern is seen in the right hemisphere, in which only islands of continuity of the tVFS map representation were found. The intensities of maps are weighted by the t-statistical maps identical to the tVFS maps. Cortical representation of the vertical meridian is shown in dotted black line and representation of the horizontal meridian is shown in solid black line. (JS-3mo, L) First scan of patient JS, left hemisphere. (JS-8mo, L) Second scan of patient JS, left hemisphere. (JS-11mo, L) Third scan of patient JS, left hemisphere. (JS-3mo, R) First scan of patient JS, right hemisphere. (JS-8mo, R) Second scan of patient JS, right hemisphere. (JS-11mo, R) Third scan of patient JS, right hemisphere. The color-bar refers to the t-values of the tVFS maps (significance of the retinotopic response).
Figure 6
Figure 6
Reorganization of retinotopic visual areas in the affected (right) hemisphere of patient JS shown on the reconstructed brain surface. Areas V1, V2d, V2v, V3, VP, V3a, and V4 are shown in different semi-transparent colors as specified in the Figure legend. Location and size of visual areas in the previous scan is outlined in white or black, for negative field sign and positive field sign areas respectively. (Top) Overtime changes in retinotopic visual areas registered in spherical coordinate system. Data from three scans of patient JS are shown: JS-3, 8 and 11mo. (Bottom) Overtime changes in retinotopic visual areas overlaid on the flattened representation of the occipital cortex. Locations of the center of mass of areas V2d, V2v, V3, VP, V3a, and V4 are shown by dots having same color as specified in the Figure legend, but decreased brightness. Locations of the center of mass of the same areas in the previous scan are shown by white or black dots, for negative field sign and positive field sign areas correspondingly. Directions of reorganization of retinotopic areas V2d, V2v, V3, VP, V3a, and V4 are shown by arrows. The table shows the distance of shifts of the center of mass (in mm) estimated in spherical coordinates for the above retinotopic areas in the lesioned right hemisphere, between the first and second scan (top row) and between the second and third scan (bottom row). The shifts in JS’ normal left hemisphere and in healthy controls are shown in Table 2.
Figure 7
Figure 7
Scatter plots for areas (top) V2v and (bottom) VP as defined by retinotopy mapping. X and Y-axis values indicate % BOLD signal change for voxels in the ROI at the earlier time point, for the two consecutive scans. Left hemisphere scatter plot is shown in red asterisks, right hemisphere scatter plot is shown in blue circles. Coefficients of correlation for ROI defined for both hemispheres are printed on each plot. Correlation values for areas V2v, V2d, VP and V3 in both hemispheres are given in Table 3.
Figure 8
Figure 8
Retinotopic maps for a retrospective patient study (patient PF), computed based on the standard FreeSurfer pipeline (Engel et al. 1994; Sereno et al. 1995; DeYoe et al. 1996; Engel et al. 1997)., using the same stimulus as presented to patient PF and the control. Data was acquired 3 and 7 months post-stroke, and visual areas were identified by mapping the polar and eccentricity maps to the cortical surface and identifying field sign boundaries. Borders were identified automatically in FreeSurfer, and confirmed by manual inspection. Visual areas are shown in different colors (see Legend), with the lesion shown in solid green.

References

    1. Azzopardi P, Cowey A. Motion discrimination in cortically blind patients. Brain; a Journal of Neurology. 2001;124:30–46. - PubMed
    1. Baseler HA, Morland AB, Wandell BA. Topographic organization of human visual areas in the absence of input from primary cortex. J Neurosci. 1999;19:2619–2627. - PMC - PubMed
    1. Calford MB, Chino YM, Das A, et al. Neuroscience: rewiring the adult brain. Nature. 2005;438:E3. discussion E3–4. - PubMed
    1. Carmichael ST. Plasticity of cortical projections after stroke. Neuroscientist. 2003;9:64–75. - PubMed
    1. Chen LM, Qi HX, Kaas JH. Dynamic reorganization of digit representations in somatosensory cortex of nonhuman primates after spinal cord injury. J Neurosci. 2012;32:14649–14663. - PMC - PubMed

Publication types