. 2013 Dec 17;4(6):e00889-13.
doi: 10.1128/mBio.00889-13.

Emergence of the epidemic methicillin-resistant Staphylococcus aureus strain USA300 coincides with horizontal transfer of the arginine catabolic mobile element and speG-mediated adaptations for survival on skin

Affiliations

Emergence of the epidemic methicillin-resistant Staphylococcus aureus strain USA300 coincides with horizontal transfer of the arginine catabolic mobile element and speG-mediated adaptations for survival on skin

Paul J Planet et al. mBio. .

Abstract

The arginine catabolic mobile element (ACME) is the largest genomic region distinguishing epidemic USA300 strains of methicillin-resistant Staphylococcus aureus (MRSA) from other S. aureus strains. However, the functional relevance of ACME to infection and disease has remained unclear. Using phylogenetic analysis, we have shown that the modular segments of ACME were assembled into a single genetic locus in Staphylococcus epidermidis and then horizontally transferred to the common ancestor of USA300 strains in an extremely recent event. Acquisition of one ACME gene, speG, allowed USA300 strains to withstand levels of polyamines (e.g., spermidine) produced in skin that are toxic to other closely related S. aureus strains. speG-mediated polyamine tolerance also enhanced biofilm formation, adherence to fibrinogen/fibronectin, and resistance to antibiotic and keratinocyte-mediated killing. We suggest that these properties gave USA300 a major selective advantage during skin infection and colonization, contributing to the extraordinary evolutionary success of this clone.

Importance: Over the past 15 years, methicillin-resistant Staphylococcus aureus (MRSA) has become a major public health problem. It is likely that adaptations in specific MRSA lineages (e.g., USA300) drove the spread of MRSA across the United States and allowed it to replace other, less-virulent S. aureus strains. We suggest that one major factor in the evolutionary success of MRSA may have been the acquisition of a gene (speG) that allows S. aureus to evade the toxicity of polyamines (e.g., spermidine and spermine) that are produced in human skin. Polyamine tolerance likely gave MRSA multiple fitness advantages, including the formation of more-robust biofilms, increased adherence to host tissues, and resistance to antibiotics and killing by human skin cells.


Figures

FIG 1
FIG 1
Prevalence of ACME genes in S. aureus and S. epidermidis. (A) Open reading frames (ORFs) of the 31-kb ACME. Integrase genes are red, speG locus genes are orange, arc genes are green, and opp genes are black. (B) Proportions of strains positive for ACME genes by either PCR or BLAST-based screening (see Materials and Methods). The first two pie charts represent a broad survey of geographically and genotypically diverse genomes (see the supplemental material). Note that in S. epidermidis the genes are found in different combinations, whereas in S. aureus the genes are only found together. The third pie chart shows presence of ACME genes in 192 environmental and clinical isolates (53), 137 of which were identified as belonging to the clonal complex of USA300 (ST8) by spa typing.
FIG 2
FIG 2
Phylogenetic reconstruction of ACME. (A) Reconciled gene genealogy for arcA (green), aliD (red), and speG (black), which depicts the smallest number of reticulation events based on each gene tree. Numbers on branches are Bayesian clade credibility values for the speG locus phylogeny. The polytomy indicated by the green bar represents ACME loci from US300 strains and their very close relatives from S. epidermidis and includes all strains found in the tree in panel B. Note that arcA, speG, and aliD coalesced in the same genome just prior to the putative transfer (HGT) to USA300 strains. (B) Bayesian chronogram of ACME loci from the polytomy depicted in panel A, calibrated using the dates of strain isolation. The node bars indicate the uncertainty (95% highest posterior density) for the divergence times. Branch values are the posterior probabilities of clade credibility. (B) Inset shows the distribution of sampled dates for calculation of divergence times from the Bayesian analysis. Abbreviations: Se, S. epidermidis; Sa, S. aureus; Sp, Staphylococcus pettenkoferi; Sc, Staphylococcus capitis.
FIG 3
FIG 3
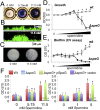
Biofilm formation in the presence of spermidine. (A) Crystal violet (CV)-stained biofilms formed after exposure of wild-type USA300 to spermidine. (B) Confocal imaging of wild-type USA300 expressing GFP, grown with and without spermidine. Note the formation of larger dome-shaped structures in the spermidine-exposed bacteria. The black bar shows the scale (20 µm). (C) Grossly visible clumping/autoaggregation of strains exposed to spermidine (magnification, ×40). (D and E) Growth (18 h, 37°C, in TSB with 0.4% glucose) and biofilm formation, respectively, in various concentrations of spermidine (0, 0.35, 0.7, 1.4, 2.8, 5.6, 6.5, 7.5, 9.4, and 11.5 mM) for wild-type (wt) and ΔspeG strains. Major increases in biofilm formation occur at levels of spermidine that are lethal to the ΔspeG strain. Data were analyzed with a one-way ANOVA. “*” indicates P < 0.001 for a Bonferroni posttest comparing the wild type to the ΔspeG strain. (F) Biofilm formation as quantified by a CV assay for the wild-type USA300 strain compared with isogenic ΔspeG mutant strains at various concentrations of spermidine (0 mM, 5.75 mM, and 11.5 mM) and spermine (0 mM, 1 mM, and 5 mM). The complemented (ΔspeG + pSpeG) and vector control (ΔspeG + vector) strains are also shown. Data shown constitute a single representative of the experiment, which was replicated in quintuplicate. A one-way ANOVA test was performed for each strain, comparing each of the three concentrations for each polyamine. Asterisks indicate a Dunnett’s posttest result of P < 0.01 when comparing each value with that for the no-spermidine control for each strain. Note that asterisks in parentheses denote values for severely attenuated growth and are therefore not due to decreased biofilm formation.
FIG 4
FIG 4
Properties of the spermidine-enhanced biofilm. (A) Effect of initial pH on biofilm formation by wild-type USA300. Strains were grown either in the presence of spermidine (Spd) (0 mM, 5.75 mM, or 11.5 mM) or in culture medium with matching pH titrated by addition of NaOH (light gray, pH 8.14; black, pH 8.85). Biofilms were measured using the crystal violet assay. Histograms show a single representative result from one experimental replicate. All experiments were repeated three times. A one-way ANOVA with Tukey’s posttest was used for analysis. *, P < 0.05; ****, P < 0.0001. NASpd, N-acetylspermidine. (B to D) Effect of proteinase K (10 µg/ml) (B), DNase (2 µg/ml) (C), or dispersin B (10 µg/ml) (D) on wild-type USA300 after growth in various concentrations of spermidine (0 mM, 5.75 mM, and 11.5 mM). Biofilms formed overnight were treated (gray) with proteinase K, DNase, or dispersin B for 1 h and then measured with the CV assay. One-way ANOVA was used to analyze data at each spermidine concentration. **, P < 0.01 after Dunnett’s posttest comparing each treatment value with that for the untreated control (black).
FIG 5
FIG 5
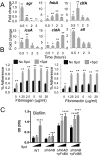
Biofilm and adhesin genes in spermidine-enhanced biofilms. (A) Wild-type USA300 was grown in broth with or without spermidine (11.5 mM) for 0.5, 1, 2, and 3 h, and mRNA levels were analyzed by qRT-PCR (see Materials and Methods). Relative quantification (RQ) fold difference values from triplicate readings in one representative experiment with standard deviations are shown. The experiment was replicated in triplicate. Results are expressed as the ratio of mRNA transcript (pmol/vol) between spermidine-exposed and -unexposed bacteria at each time point. A one-way ANOVA test was used to analyze the data. **, P < 0.001; *, P < 0.05 after a Bonferroni posttest comparing exposed to unexposed samples at each time point). (B) Wild-type USA300 adherence to fibronectin/fibrinogen (0, 1.25, 2.5, 5, 10, or 20 µg/ml)-coated plates. BacTiter-Glo luminescence was used to quantify the proportion of adherent bacteria. Values represent proportions of luminescence measured when wells were washed to total luminescence in the entire well. One-way ANOVA was used to analyze these data. **, P < 0.001; *, P < 0.05 (after a Bonferroni posttest comparing exposed to unexposed samples at each fibrinogen/fibronectin concentration). (C) Crystal violet (CV) biofilm assay; results for the fibronectin binding protein double mutant (ΔfnbAB) and complemented mutants expressing either fnbA or fnbB in trans are compared to those for the isogenic wild-type strain with biofilms grown with 0 mM (black), 5.75 mM (light gray), or 11.5 mM (dark gray) of spermidine. Results show one representative experiment. The experiment was repeated in triplicate. A one-way ANOVA test was used to analyze these data. ****, P < 0.0001; ***, P < 0.001; **, P < 0.01; and *, P < 0.05 after Dunnett’s posttest for each strain compared to the 0 mM spermidine condition.
FIG 6
FIG 6
Spermidine synergy with antibiotics and human keratinocytes. (A) Oxacillin Etest on solid agar in the presence or absence of spermidine at 5.75 mM. Note that changes in both halo diameter and the point of intersection with the strip show less synergy between oxacillin and spermidine when speG is present. (B) Table of the Etest MIC data for other important antistaphylococcal antibiotics. All Etest values were determined in triplicate. Light-gray cells denote MIC changes of 2 dilutions with addition of spermidine, darker gray cells indicate MIC changes of more than 2 dilutions. An asterisk denotes a change in the maximum halo diameter of more than 50%. (C) Shown are growth/survival at different concentrations of spermidine for wild-type USA300 or the isogenic ΔspeG mutant after 24 h of culture on a confluent layer of human keratinocytes (HaCats). Black bars show growth in HaCat medium without keratinocytes. One-way ANOVA P values were 0.0364 and 0.0038 for the ΔspeG strain and the wild type, respectively.

References

    1. Tenover FC, Goering RV. 2009. Methicillin-resistant Staphylococcus aureus strain USA300: origin and epidemiology. J. Antimicrob. Chemother. 64:441–446 - PubMed
    1. Moran GJ, Krishnadasan A, Gorwitz RJ, Fosheim GE, McDougal LK, Carey RB, Talan DA, EMERGEncy ID Net Study Group 2006. Methicillin-resistant S. aureus infections among patients in the emergency department. N. Engl. J. Med. 355:666–674.10.1056/NEJMoa055356 - DOI - PubMed
    1. Seybold U, Kourbatova EV, Johnson JG, Halvosa SJ, Wang YF, King MD, Ray SM, Blumberg HM. 2006. Emergence of community-associated methicillin-resistant Staphylococcus aureus USA300 genotype as a major cause of health care-associated blood stream infections. Clin. Infect. Dis. 42:647–656 - PubMed
    1. Klevens RM, Morrison MA, Nadle J, Petit S, Gershman K, Ray S, Harrison LH, Lynfield R, Dumyati G, Townes JM, Craig AS, Zell ER, Fosheim GE, McDougal LK, Carey RB, Fridkin SK, Active Bacterial Core surveillance (ABCs) MRSA Investigators 2007. Invasive methicillin-resistant Staphylococcus aureus infections in the United States. JAMA 298:1763–1771 - PubMed
    1. Otto M. 2011. A MRSA-terious enemy among us: end of the PVL controversy? Nat. Med. 17:169–170 - PubMed

Publication types

MeSH terms