

Cardioprotection during diabetes: the role of mitochondrial DNA
- PMID: 24346177
- PMCID: PMC3975667
- DOI: 10.1097/ALN.0000000000000107
Cardioprotection during diabetes: the role of mitochondrial DNA
Abstract
Background: Diabetes alters mitochondrial bioenergetics and consequently disrupts cardioprotective signaling. The authors investigated whether mitochondrial DNA (mtDNA) modulates anesthetic preconditioning (APC) and cardiac susceptibility to ischemia-reperfusion injury by using two strains of rats, both sharing nuclear genome of type 2 diabetes mellitus (T2DN) rats and having distinct mitochondrial genomes of Wistar and fawn-hooded hypertensive (FHH) rat strains (T2DN(mtWistar) and T2DN(mtFHH), respectively).
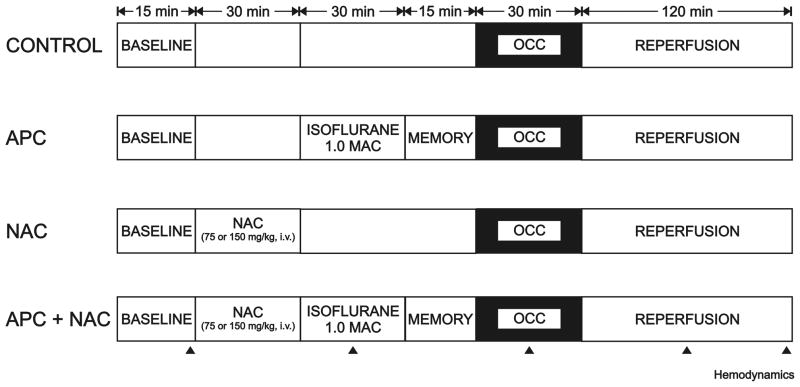
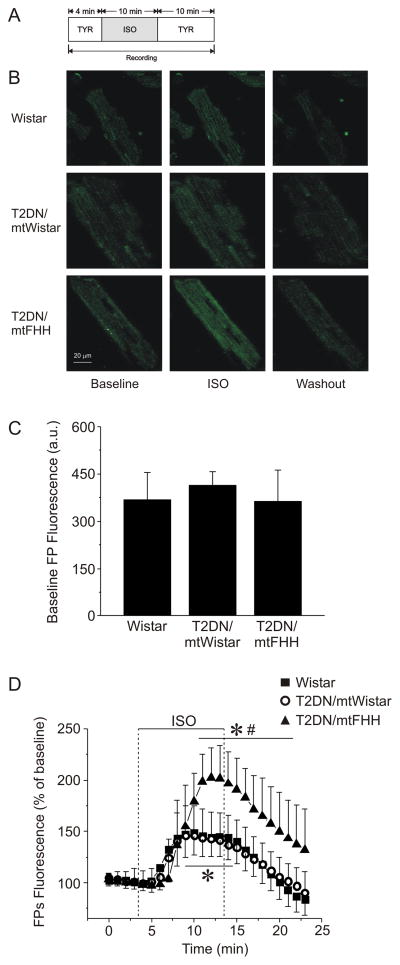
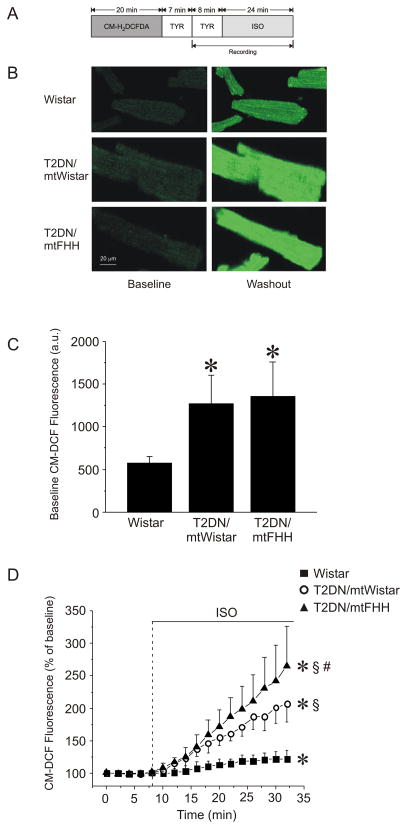
Methods: Myocardial infarct size was measured in Wistar, T2DN(mtWistar), and T2DN(mtFHH) rats with or without APC (1.4% isoflurane) in the presence or absence of antioxidant N-acetylcysteine. Flavoprotein fluorescence intensity, a marker of mitochondrial redox state, 5-(and-6)-chloromethyl-2',7'-dichlorofluorescein fluorescence intensity, a marker of reactive oxygen species generation, and mitochondrial permeability transition pore opening were assessed in isolated rat ventricular cardiomyocytes with or without isoflurane (0.5 mmol/l).
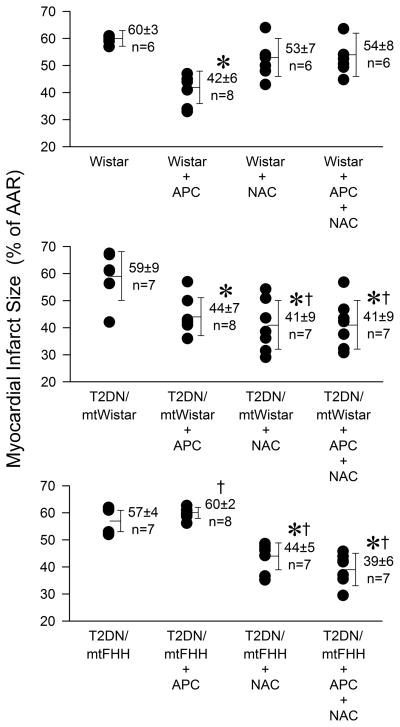
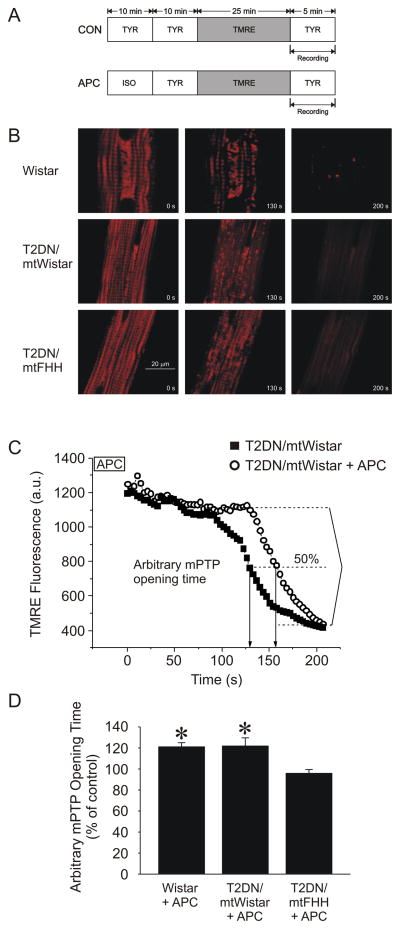
Results: Myocardial infarct size was decreased by APC in Wistar and T2DN(mtWistar) rats (to 42 ± 6%, n = 8; and 44 ± 7%, n = 8; of risk area, respectively) compared with their respective controls (60 ± 3%, n = 6; and 59 ± 9%, n = 7), but not in T2DN(mtFHH) rats (60 ± 2%, n = 8). N-acetylcysteine applied during isoflurane treatment restored APC in T2DN(mtFHH) (39 ± 6%, n = 7; and 38 ± 5%, n = 7; 150 and 75 mg/kg N-acetylcysteine, respectively), but abolished protection in control rats (54 ± 8%, n = 6). Similar to the data on infarct size, APC delayed mitochondrial permeability transition pore opening in T2DN(mtWistar) but not in T2DN(mtFHH) cardiomyocytes. Isoflurane increased flavoprotein and 5-(and-6)-chloromethyl-2',7'-dichlorofluorescein fluorescence intensity in all rat strains, with the greatest effect in T2DN(mtFHH) cardiomyocytes.
Conclusion: Differences in the mitochondrial genome modulate isoflurane-induced generation of reactive oxygen species which translates into differential susceptibility to APC and ischemia-reperfusion injury in diabetic rats.
Conflict of interest statement
Figures
References
-
- Achilli A, Olivieri A, Pala M, Hooshiar Kashani B, Carossa V, Perego UA, Gandini F, Santoro A, Battaglia V, Grugni V, Lancioni H, Sirolla C, Bonfigli AR, Cormio A, Boemi M, Testa I, Semino O, Ceriello A, Spazzafumo L, Gadaleta MN, Marra M, Testa R, Franceschi C, Mitoch Torroni A. Mitochondrial DNA backgrounds might modulate diabetes complications rather than T2DM as a whole. PLoS One. 2011;6:e21029. - PMC - PubMed
-
- Lowell BB, Shulman GI. Mitochondrial dysfunction and type 2 diabetes. Science. 2005;307:384–7. - PubMed
-
- Wang SL, Head J, Stevens L, Fuller JH. Excess mortality and its relation to hypertension and proteinuria in diabetic patients. The world health organization multinational study of vascular disease in diabetes. Diabetes Care. 1996;19:305–12. - PubMed
-
- Morrish NJ, Wang SL, Stevens LK, Fuller JH, Keen H. Mortality and causes of death in the WHO Multinational Study of Vascular Disease in Diabetes. Diabetologia. 2001;44(Suppl 2):S14–21. - PubMed
-
- Burwell LS, Brookes PS. Mitochondria as a target for the cardioprotective effects of nitric oxide in ischemia-reperfusion injury. Antioxid Redox Signal. 2008;10:579–99. - PubMed
Publication types
MeSH terms
Substances
Grants and funding
LinkOut - more resources
Full Text Sources
Other Literature Sources
Medical
