. 2014 Feb 7;289(6):3231-43.
doi: 10.1074/jbc.M113.517649. Epub 2013 Dec 17.

The reverse gyrase from Pyrobaculum calidifontis, a novel extremely thermophilic DNA topoisomerase endowed with DNA unwinding and annealing activities

Affiliations

The reverse gyrase from Pyrobaculum calidifontis, a novel extremely thermophilic DNA topoisomerase endowed with DNA unwinding and annealing activities

Anmbreen Jamroze et al. J Biol Chem. .

Abstract

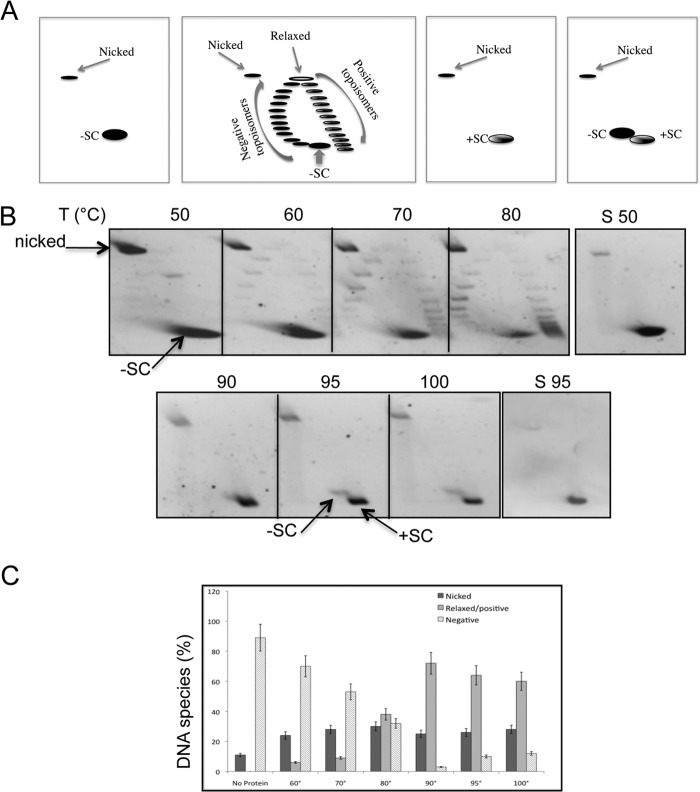
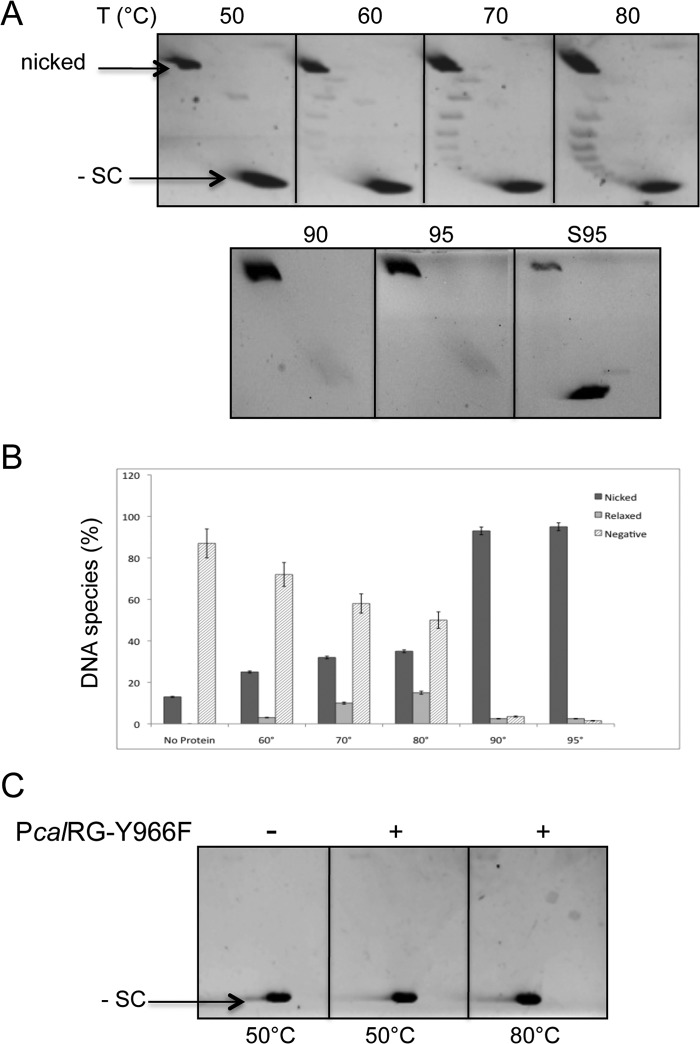
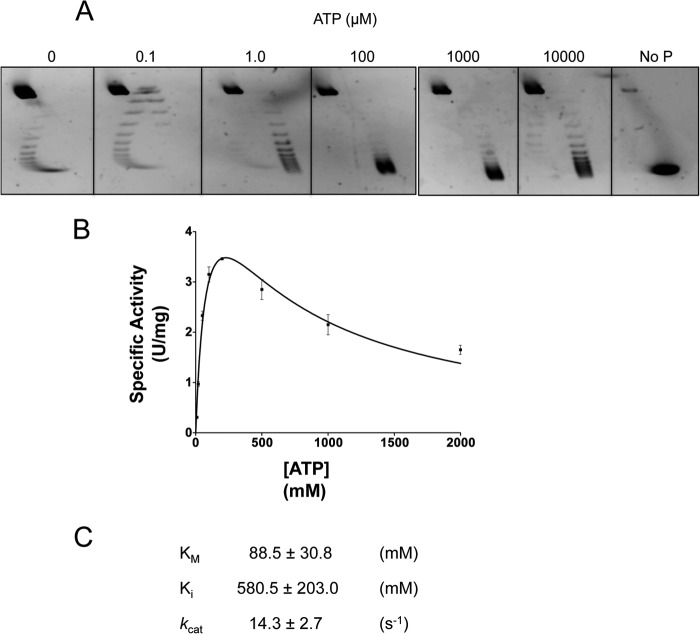
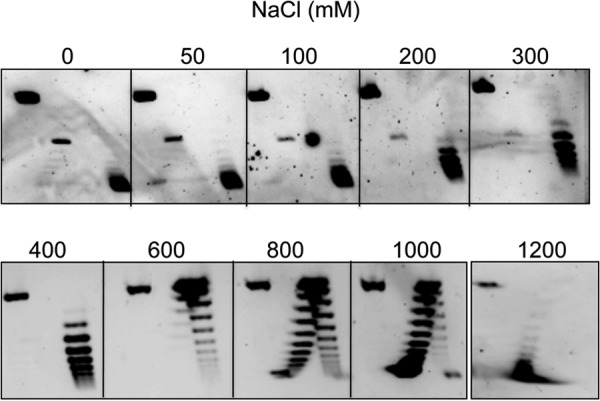
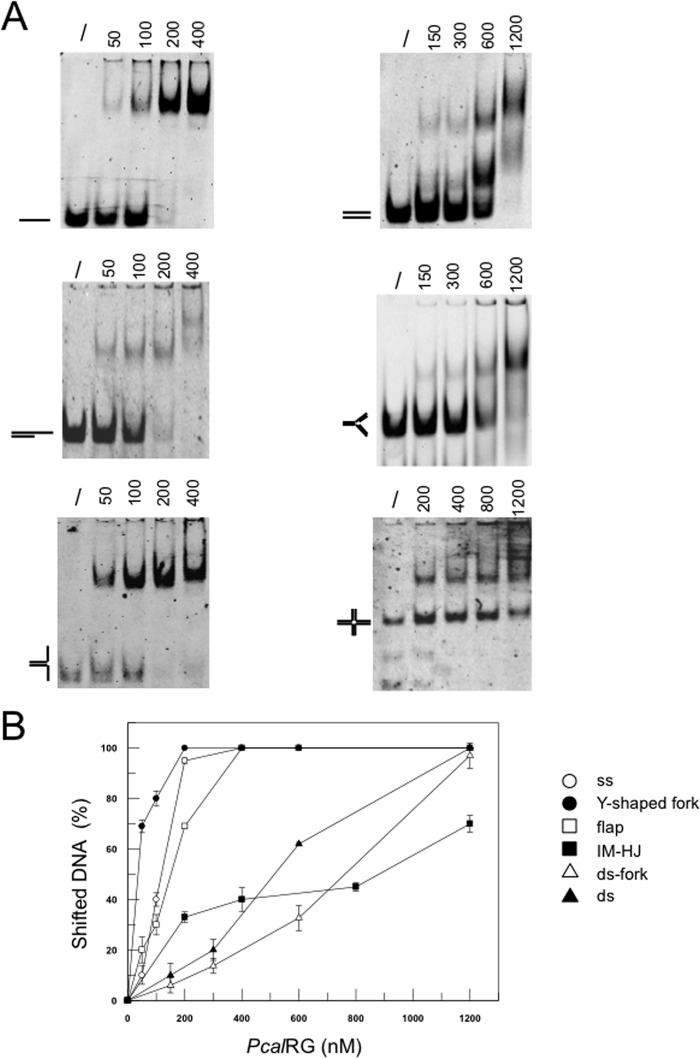
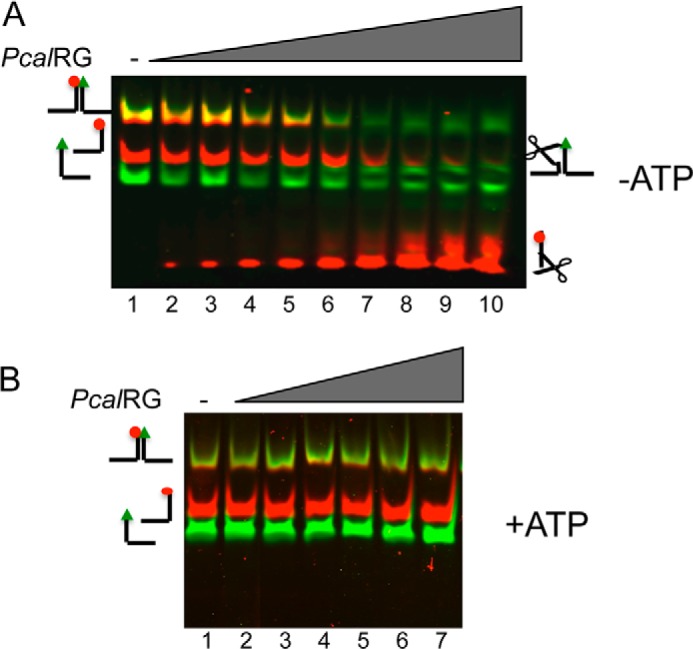
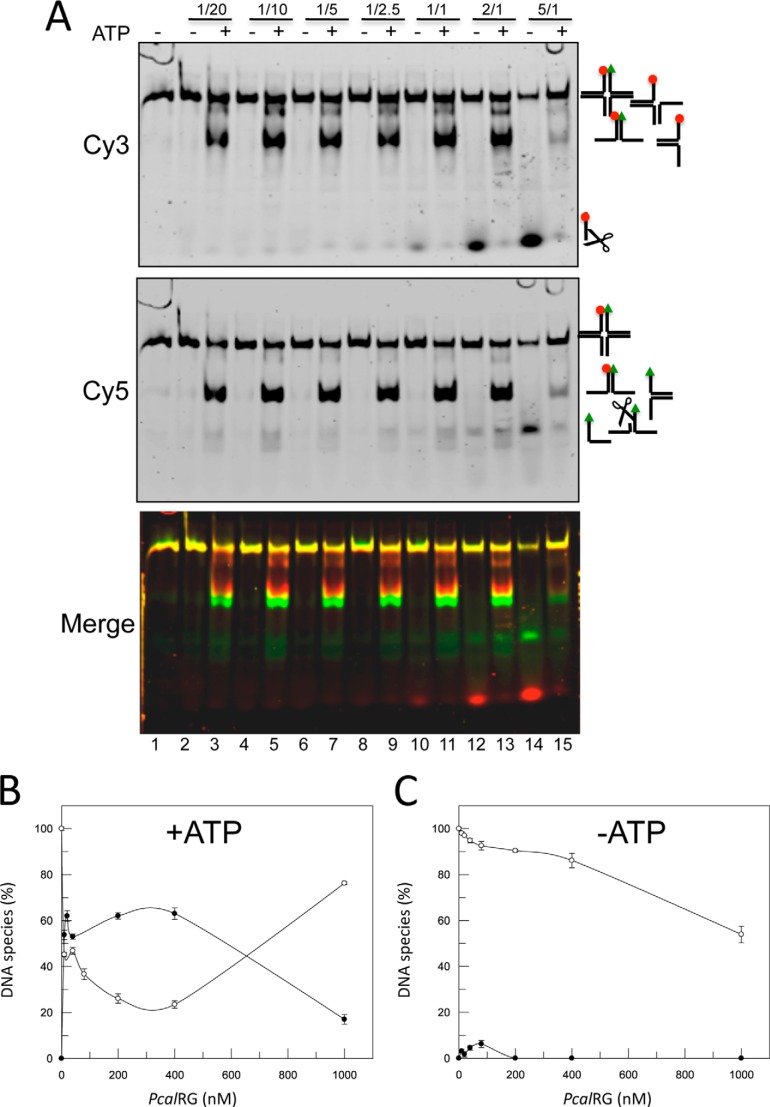
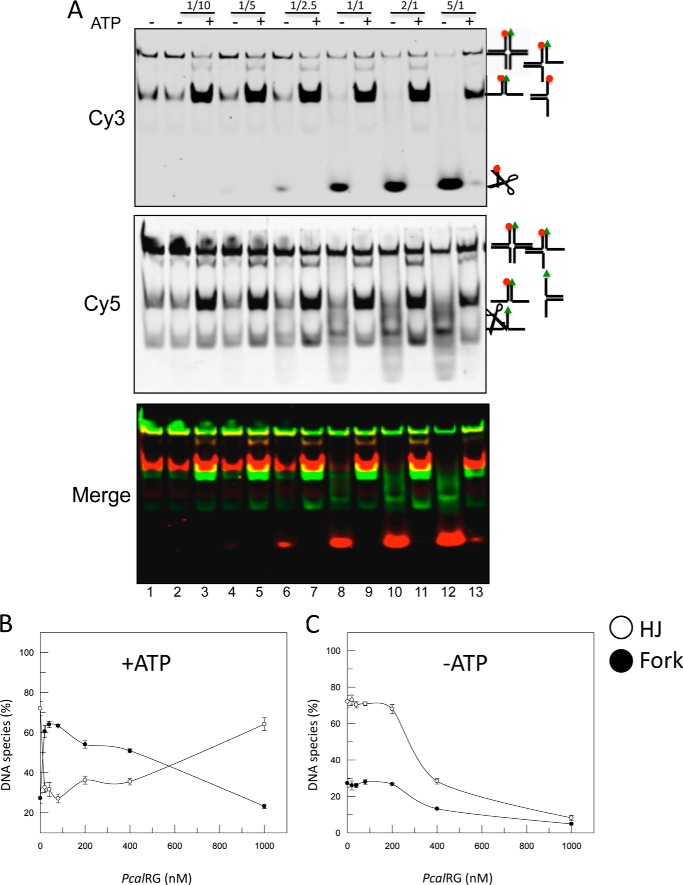
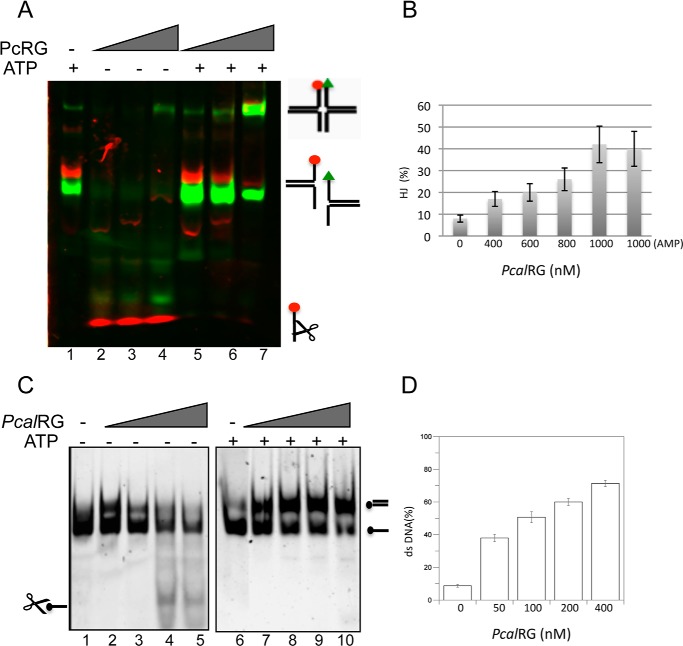
Reverse gyrase is a DNA topoisomerase specific for hyperthermophilic bacteria and archaea. It catalyzes the peculiar ATP-dependent DNA-positive supercoiling reaction and might be involved in the physiological adaptation to high growth temperature. Reverse gyrase comprises an N-terminal ATPase and a C-terminal topoisomerase domain, which cooperate in enzyme activity, but details of its mechanism of action are still not clear. We present here a functional characterization of PcalRG, a novel reverse gyrase from the archaeon Pyrobaculum calidifontis. PcalRG is the most robust and processive reverse gyrase known to date; it is active over a wide range of conditions, including temperature, ionic strength, and ATP concentration. Moreover, it holds a strong ATP-inhibited DNA cleavage activity. Most important, PcalRG is able to induce ATP-dependent unwinding of synthetic Holliday junctions and ATP-stimulated annealing of unconstrained single-stranded oligonucleotides. Combined DNA unwinding and annealing activities are typical of certain helicases, but until now were shown for no other reverse gyrase. Our results suggest for the first time that a reverse gyrase shares not only structural but also functional features with evolutionary conserved helicase-topoisomerase complexes involved in genome stability.

Keywords: DNA Enzymes; DNA Helicase; DNA Recombination; DNA Repair; DNA Topoisomerase; Holliday Junction; Thermophiles.


Figures

FIGURE 1.
FIGURE 1.
The PcalRG ATP-dependent positive supercoiling activity. A, diagram of two-dimensional gels showing the relative migration of plasmid topoisomers and nicked forms; −SC, +SC, highly negative and positive topoisomers, respectively; negative topoisomers with different degree of relaxation migrate on the left arm and topoisomers with different degree of positive supercoiling on the right arm of the arc. B, temperature dependence of the PcalRG positive supercoiling activity. Standard assays were set up in a final volume of 20 μl, incubated for 10 min at the indicated temperatures (°C), and subjected to two-dimensional agarose gel electrophoresis. All reactions contained 6.0 nm (300 ng) pQE31, 50 nm (150 ng) of PcalRG (P/D molar ratio 8/1), and ATP (1.0 mm). S50, S95, plasmid DNA was mock incubated at either 50 or 95 °C, respectively. Symbols are as in A. Each incubation condition was tested at least three times; representative gels are shown. C, quantification of the PcalRG positive supercoiling activity at different temperatures. The intensity of all bands in two-dimensional gels determined by densitometric analysis was used to calculate the amount of total DNA and the fraction of products (nicked and relaxed/positive) as well as unprocessed substrate (negative). Values are the mean of three independent experiments set as in B. Numbers on the x-axis indicate the incubation temperature (°C); the No protein control is plasmid DNA mock incubated at 95 °C.
FIGURE 2.
FIGURE 2.
A, temperature dependence of the PcalRG ATP-independent DNA relaxation activity. Reactions were set and analyzed as described in the legend to Fig. 1B with the exception that no ATP was included. Each incubation condition was tested at least three times; representative gels are shown. B, quantification of the PcalRG DNA relaxation activity at different temperatures. Values determined as described in the legend to Fig. 1C are the mean of three independent experiments set as described in A. Numbers on the x-axis indicate the incubation temperature (°C); the No protein control is plasmid DNA mock incubated at 95 °C. C, two-dimensional gel analysis of the PcalRG-Y966F mutant activity. Reactions were set and analyzed as described in the legend to Fig. 1B using the mutant protein instead of wild-type. The temperature of incubation is indicated.
FIGURE 3.
FIGURE 3.
ATP concentration dependence and ATPase activity of PcalRG. A, positive supercoiling activity at different of ATP concentrations. Reactions (P/D = 8/1) were set and analyzed as described in the legend to Fig. 1B with the indicated ATP concentrations; incubation was at 85 °C. B and C, kinetic analysis of the ATPase activity. Steady-state kinetic constants were determined using the Malachite Green kit (see “Experimental Procedures”). Reactions containing 10 ng/μl of PcalRG, 200 ng of pQE31, and varying ATP concentrations were incubated at 85 °C for different times (0, 1, 2, 5, 10 min). Specific activities are expressed as units/mg, where one unit is the amount of enzyme able to hydrolyze 1.0 μmol of ATP to ADP and inorganic phosphate in 1 min under the conditions indicated. Values are the mean ± S.E. of three independent experiments.
FIGURE 4.
FIGURE 4.
Effect of ionic strength on the PcalRG positive supercoiling activity. Reactions were set and analyzed as described in the legend to Fig. 1 with the exception that buffer contained the indicated NaCl concentration and incubation was at 85 °C.
FIGURE 5.
FIGURE 5.
A, EMSA analysis of PcalRG DNA binding activity. The indicated amounts (ng) of PcalRG were incubated in 10-μl reaction mixture for 10 min at 37 °C with the indicated fluorescently end labeled substrates (40 nm each); ss was the 40-nt A2 oligonucleotide (30). /: no protein. In each gel the free substrate is indicated. B, quantification of DNA binding activity: for each DNA ligand, the fraction of shifted DNA in each lane versus the amount of protein used was plotted. Values are the mean ± S.E. of three independent experiments.
FIGURE 6.
FIGURE 6.
Activity of PcalRG on the Y-shaped fork. A, Cy3, Cy5-end-labeled Y-shaped fork was incubated at 55 °C for 10 min without (lane 1) or with increasing amounts of PcalRG in the absence of 1.0 mm ATP. The following P/D ratios were used: lane 2: 1/40; lane 3: 1/20; lane 4: 1/15; lane 5: 1/10; lane 6, 1/5; lane 7: 1/2.5; lane 8: 1/1; lane 9: 2/1; lane 10: 5/1. B, Y-shaped fork was incubated as in A without (lane 1) or with increasing amounts of PcalRG in the presence of 1.0 mm ATP. The following P/D ratios were used: lane 2: 1/15; lane 3: 1/10; lane 4: 1/5; lane 5: 1/2.5; lane 6: 1/1; lane 7: 2/1. Samples were run, and gel was scanned under the appropriate conditions (as described under “Experimental Procedures”) to follow the Cy3 and Cy5 fluorophores; the merged image of each gel is shown.
FIGURE 7.
FIGURE 7.
Resolution of IM-HJ by PcalRG. A, IM-HJ was incubated at 55 °C for 10 min without (lane 1) or with increasing amounts of PcalRG in the absence or presence of 1 mm ATP as indicated. The following P/D ratios were used: lanes 2, 3: 1/20; lanes 4, 5: 1/10; lanes 6, 7: 1/5; lanes 8, 9: 1/2.5; lanes 10, 11: 1/1; lanes 12, 13: 2/1; lanes 14, 15: 5/1. Samples were run, and gel was scanned under the appropriate conditions (as described under “Experimental Procedures”) to follow the fluorophores shown on the left. Reaction substrate and products are shown on the right; scissors indicate cleavage products. B and C, quantification of the results shown in A. For clarity, only the fractions of HJs and Y-shaped forks versus protein concentration in each Cy5-scanned gel are plotted using GraFit version 5.0.11 (Erithacus Software Limited). In samples without ATP, the total amount of HJs +forks was reduced with increasing protein concentration due to the cleavage activity of the enzyme. To simplify the pattern, the quantification of the cleavage product is not shown. Values are the mean ± S.E. of three independent experiments.
FIGURE 8.
FIGURE 8.
Resolution of M-HJ by PcalRG. A, experiment was set and analyzed as described in the legend to Fig. 6 with the exception that the M-HJ was used. The following P/D ratios were used: lanes 2, 3: 1/10; lanes 4, 5: 1/5; lanes 6, 7: 1/2.5; lanes 8, 9: 1/1; lanes 10, 11: 2/1; lanes 12, 13: 5/1. B and C, quantification of the results shown in A.
FIGURE 9.
FIGURE 9.
PcalRG-promoted DNA annealing. A, annealing of the HJ components. The oligonucleotides A1, A2, A5, and A6 (50 nm each) were incubated at 55 °C for 10 min without (lane 1) or with increasing amounts of PcalRG and 1.0 mm ATP where indicated, at the following P/D: lanes 2, 5: 1/1; lanes 3, 6: 2/1; lanes 4,7: 5/1. B, quantification of the HJ components annealing in the presence of 1.0 mm ATP or 1 mm AMP (last sample). The fraction of HJ versus protein concentration is plotted. Values are the mean ± S.E. of three independent experiments. The plot of samples without nucleotide is not shown because the cleavage activity prevented proper quantification. C, annealing of fully complementary oligonucleotides at high temperature. 70-Lead and 70-Lag oligonucleotides (40 nm each), were incubated at 85 °C for 10 min without (lanes 1 and 6) or with increasing amounts of PcalRG and 1.0 mm ATP where indicated, at the following P/D: lanes 2, 7: 0.6/1; lanes 3, 8: 1.25/1; lanes 4, 9: 2.5/1; lanes 5, 10: 5/1. The gel was scanned under the appropriate conditions to detect the Cy5 fluorophore. D, quantification of the 70-Lead-70-Lag oligonucleotides annealing in the presence of 1.0 mm ATP. The fraction of dsDNA versus protein concentration is plotted. Values are the mean ± S.E. of three independent experiments. The plot of samples without ATP is not shown because the cleavage activity prevented proper quantification of dsDNA.

Similar articles

Cited by

References

    1. Brochier-Armanet C., Forterre P. (2007) Widespread distribution of archaeal reverse gyrase in thermophilic bacteria suggests a complex history of vertical inheritance and lateral gene transfers. Archaea 2, 83–93 - PMC - PubMed
    1. Nadal M. (2007) Reverse gyrase: an insight into the role of DNA-topoisomerases. Biochimie 89, 447–455 - PubMed
    1. Perugino G., Valenti A., D'amaro A., Rossi M., Ciaramella M. (2009) Reverse gyrase and genome stability in hyperthermophilic organisms. Biochem. Soc. Trans. 37, 69–73 - PubMed
    1. Heine M., Chandra S. B. (2009) The linkage between reverse gyrase and hyperthermophiles: a review of their invariable association. J. Microbiol. 47, 229–234 - PubMed
    1. Atomi H., Matsumi R., Imanaka T. (2004) Reverse gyrase is not a prerequisite for hyperthermophilic life. J. Bacteriol. 186, 4829–4833 - PMC - PubMed

Publication types

MeSH terms