. 2010 Jan;5(1):10.2217/fnl.09.78.
doi: 10.2217/fnl.09.78.

Early Detection of Huntington Disease

Affiliations

Early Detection of Huntington Disease

Jane S Paulsen. Future Neurol. 2010 Jan.

Abstract

Huntington disease (HD) is a devastating illness, although its autosomal dominant genetic transmission allows a unique opportunity to study apparently healthy individuals before manifest disease. Attempts to study early disease are not unique in neurology (e.g., Mild Cognitive Impairment, Vascular Cognitive Impairment), but studying otherwise-healthy appearing individuals who will go on with nearly 99% certainty to manifest the symptoms of brain disease does provide distinct but valuable information about the true natural history of the disease. The field has witnessed an explosion of research examining possible early indicators of HD during what is now referred to as the "prodrome" of HD. A NIH study in its ninth year (PREDICT-HD) has offered a glimpse into the transition from an apparently healthy state to an obviously diseased state, and can serve as a model for many other genetic diseases, both neurological and non-neurological.

Keywords: Huntington disease; biomarkers; clinical endpoints; clinical trials; detection; diagnosis; prevention.


Figures

Figure 1
Figure 1. Diffusion tensor functional anisotropy group statistical maps
(A) Pre-Huntington’s disease. (B) Huntington’s disease. Exploratory whole-brain analyses demonstrated significant reductions in functional anisotropy in the internal capsule, frontal subcortical WM and portions of the thalamus, and increases in functional anisotropy in the putamen in the group of presymptomatic individuals known to carry the genetic mutation that causes Huntington’s disease (pre-Huntington’s disease), paralleling the results of the region of interest analysis. In the early-stage Huntington’s disease group, significant increases in the putamen and globus pallidus were observed; reductions in functional anisotropy included the internal capsule, corpus callosum, external/extreme capsule, cerebral peduncles, brainstem and WM underlying brain regions, including sensorimotor cortex, frontal, parietal and parieto–occipital areas. Blue areas show areas of statistically significant increases in functional anisotropy; yellow areas show areas of statistically significant reductions in functional anisotropy. WM: White matter. Reproduced with permission from [33];.
Figure 2
Figure 2. Volume differences and effect sizes based on comparisons of demographicaily matched normals and pre-Huntington’s disease less than 10 years from estimated motor diagnosis
GM: Grey matter; WM: White matter.
Figure 3
Figure 3. Evidence of regional cortical thinning in pre-Huntington’s disease and its relationship to striatal volume. Cortical surface reconstruction maps
Significant cortical thinning was present in the pre-Huntington’s disease group compared with controls. When adjusting for caudate volumes, the intergroup variance in thinning was less prominent over portions of superior temporal gyrus; when adjusting for putamen volumes, variance was less prominent over posterior frontal regions. Some areas of thinning appeared to be independent of caudate or putamen volumes. Maps are displayed on an average composite brain, with areas of more thinning transitioning from red (p < 0.05) to yellow (p < 0.001), unadjusted for multiple comparisons. L: Left; R; Right. Reproduced with permission from [25].
Figure 4
Figure 4. Magnetic resonance imaging signal changes
(A) Percentage MRI signal change for each region of interest in which the far group showed significantly greater activation relative to the close and control groups (i.e., far > cont = close). (B) Percentage MRI signal change for each region of interest in which a step-wise reduction in activation was observed between the three groups (i.e. cont > far > close). (C) Percentage MRI signal change for each ROI in which the close group showed significantly lower activation relative to the far and control groups (i.e., cont = far > close). Error bars = standard error of the mean. CMA: Cingulate motor area; Cont: Control; L: Left; MRI: Magnetic resonance imaging; R: Right; SMA: Supplementary motor area; STG: Superior temporal gyri. Reproduced with permission from [58].
Figure 5
Figure 5
Cognitive domain effect sizes for pre-Huntington’s disease near estimated clinical diagnosis.
Figure 6
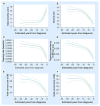
Figure 6. Relationship between estimated years to diagnosis in participants with the prodrome for Huntington’s disease and various other measures
(A) Motor exam score. (B) Striatal volume. (C) Speeded finger tapping. (D) Self-timed finger tapping. (E) Word list learning. (F) Odor identification. Solid line plots the mean; broken lines are 95% confidence limits. All relationships are adjusted for gender, age and education. SD: Standard deviation. Reproduced with permission from [10].
Figure 7
Figure 7. Difference score between pre-Huntington’s disease participants and companions on ratings of so-called ‘frontal lobe behaviors’
Solid line represents mean and dotted line represents 95% confidence interval. Highly significant association between agreement of manifest frontal behaviors and proximity to manifest motor diagnosis. Adjusted for age (40.65 years), gender (male or female) and education (14 years). FrSBe: Frontal Systems Behaviour Scale. Reproduced with permission from [100].

References

    1. A novel gene containing a trinucleotide repeat that is expanded and unstable on Huntington’s disease chromosomes. The Huntington’s Disease Collaborative Research Group. Cell. 1993;72:971–83. - PubMed
    1. Ferrante RJ, Kowall NW, Beal MF, Richardson EP, Jr, Bird ED, Martin JB. Selective sparing of a class of striatal neurons in Huntington’s disease. Science. 1985;230:561–3. - PubMed
    1. Calabresi P, Centonze D, Pisani A, et al. Striatal spiny neurons and cholinergic interneurons express differential ionotropic glutamatergic responses and vulnerability: implications for ischemia and Huntington’s disease. Ann Neurol. 1998;43:586–97. - PubMed
    1. Hedreen JC, Peyser CE, Folstein SE, Ross CA. Neuronal loss in layers V and VI of cerebral cortex in Huntington’s disease. Neurosci Lett. 1991;133:257–61. - PubMed
    1. Paulsen JS, Mikos A. Huntington’s disease. In: Morgan JE, Ricker JH, editors. Textbook of clinical neuropsychology. Taylor & Francis; New York, NY: 2007. pp. 616–635.

LinkOut - more resources