. 2013 Nov;15(11):1218-30.
doi: 10.1593/neo.121516.

PTEN phosphatase-independent maintenance of glandular morphology in a predictive colorectal cancer model system

Affiliations

PTEN phosphatase-independent maintenance of glandular morphology in a predictive colorectal cancer model system

Ishaan C Jagan et al. Neoplasia. 2013 Nov.

Abstract

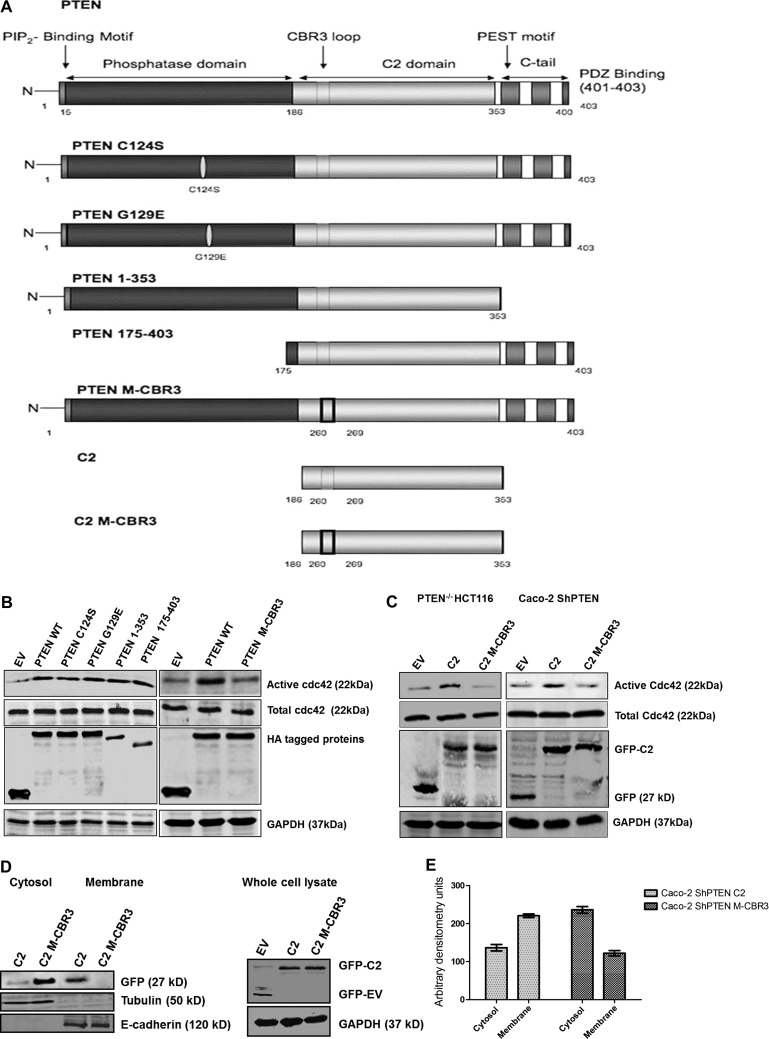
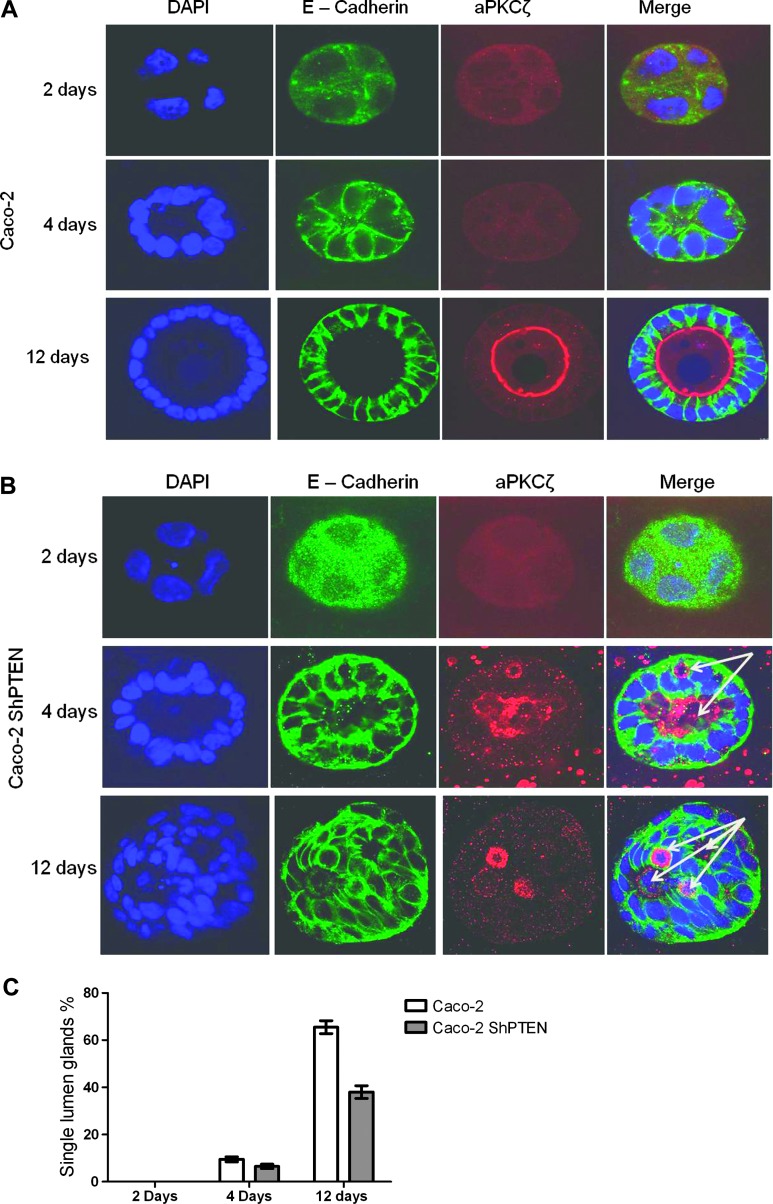
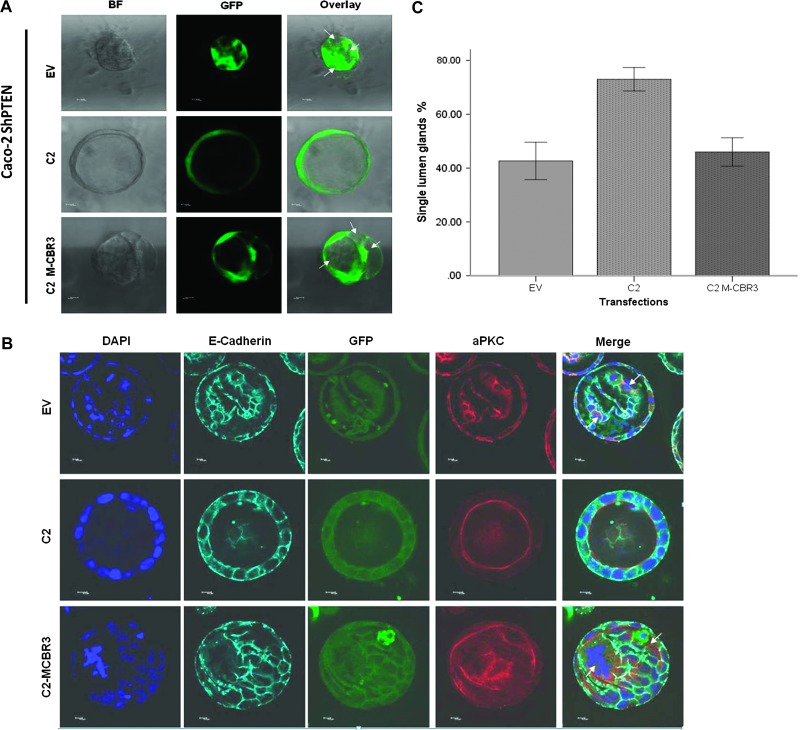
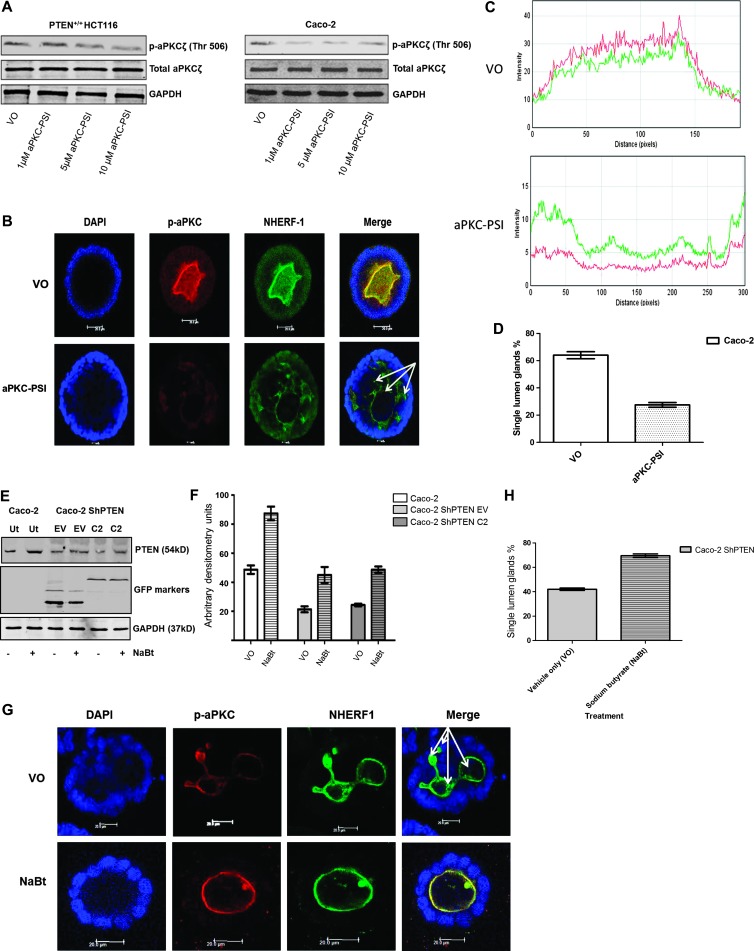
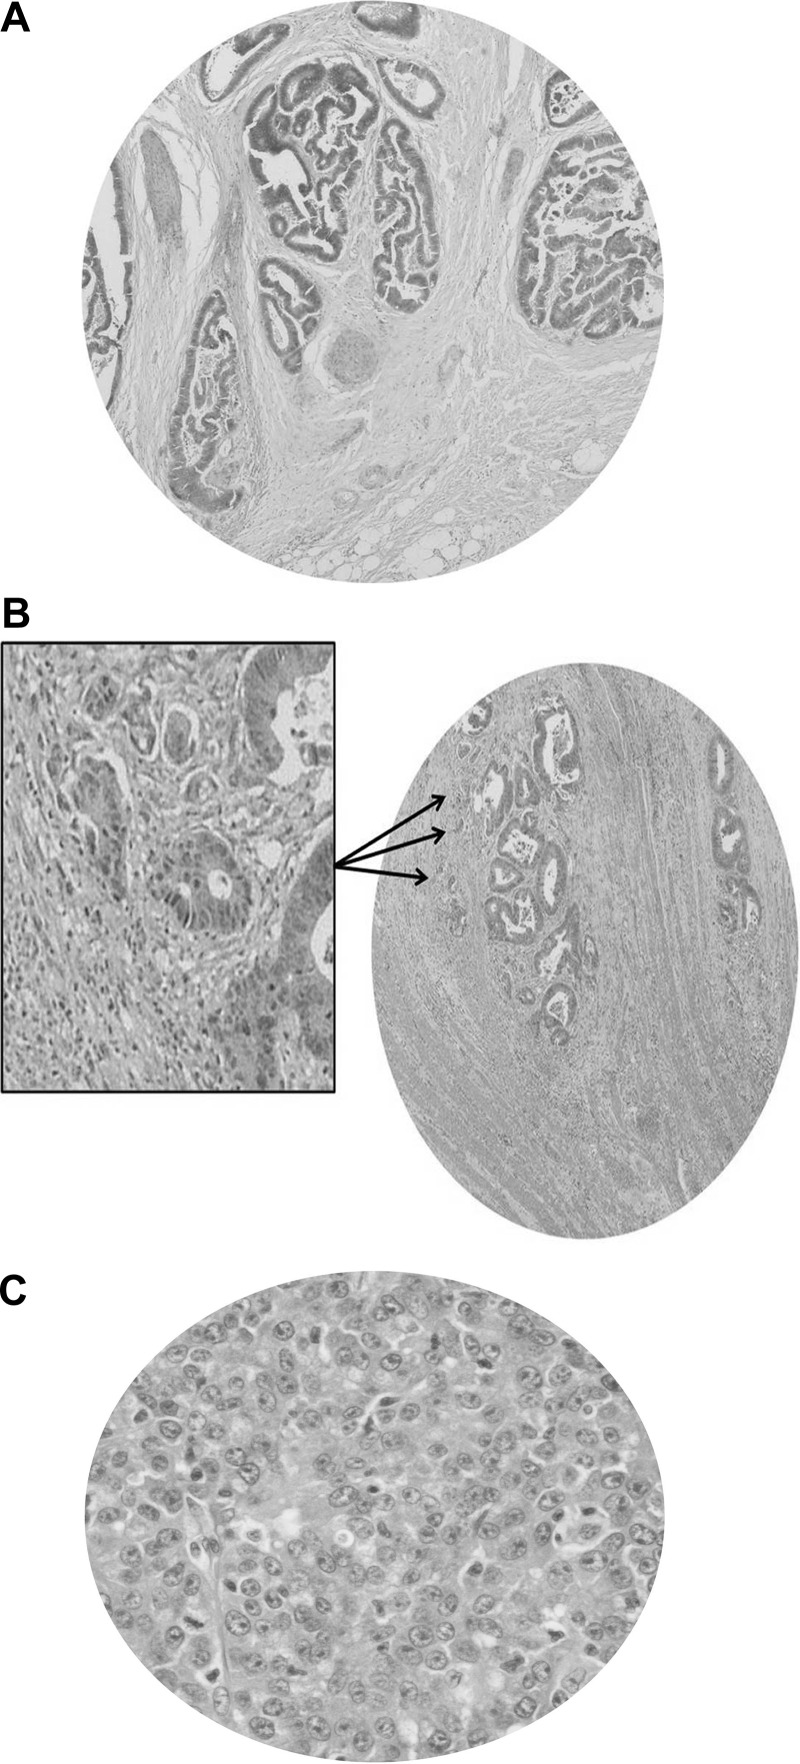
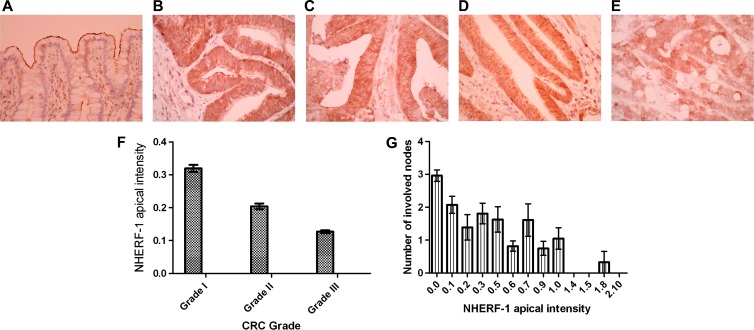
Organotypic models may provide mechanistic insight into colorectal cancer (CRC) morphology. Three-dimensional (3D) colorectal gland formation is regulated by phosphatase and tensin homologue deleted on chromosome 10 (PTEN) coupling of cell division cycle 42 (cdc42) to atypical protein kinase C (aPKC). This study investigated PTEN phosphatase-dependent and phosphatase-independent morphogenic functions in 3D models and assessed translational relevance in human studies. Isogenic PTEN-expressing or PTEN-deficient 3D colorectal cultures were used. In translational studies, apical aPKC activity readout was assessed against apical membrane (AM) orientation and gland morphology in 3D models and human CRC. We found that catalytically active or inactive PTEN constructs containing an intact C2 domain enhanced cdc42 activity, whereas mutants of the C2 domain calcium binding region 3 membrane-binding loop (M-CBR3) were ineffective. The isolated PTEN C2 domain (C2) accumulated in membrane fractions, but C2 M-CBR3 remained in cytosol. Transfection of C2 but not C2 M-CBR3 rescued defective AM orientation and 3D morphogenesis of PTEN-deficient Caco-2 cultures. The signal intensity of apical phospho-aPKC correlated with that of Na(+)/H(+) exchanger regulatory factor-1 (NHERF-1) in the 3D model. Apical NHERF-1 intensity thus provided readout of apical aPKC activity and associated with glandular morphology in the model system and human colon. Low apical NHERF-1 intensity in CRC associated with disruption of glandular architecture, high cancer grade, and metastatic dissemination. We conclude that the membrane-binding function of the catalytically inert PTEN C2 domain influences cdc42/aPKC-dependent AM dynamics and gland formation in a highly relevant 3D CRC morphogenesis model system.


Figures

Figure 1
Figure 1
PTEN functional domains and cdc42 activation. (A) PTEN constructs. Details of wt PTEN and mutant constructs are provided in the text. (B) Effects of PTEN constructs on cdc42 activation in PTEN-/- HCT116 cells. PTEN-/- HCT116 cells were transfected with HA-tagged wt or mutant PTEN constructs. Data are shown in two panels, each containing wt PTEN and EV, placed side by side. Differential gel migration according to size of deletion constructs is shown in the left HA-tagged protein blot. Those constructs containing a C2 domain with intact CBR3 loop (PTEN-wt, PTEN C124S, PTEN G129E, PTEN 1–353, PTEN 175–403) enhanced cdc42 activity more than EV or the PTEN M-CBR3 mutant. (C) Effects of PTEN C2 domain constructs on cdc42 activation in PTEN-/- HCT116 and Caco-2 ShPTEN cells. PTEN-/- HCT116 cells or Caco-2 ShPTEN cells were transfected with a GFP-tagged, isolated wt C2 domain or a C2 domain construct mutated at the CBR3 membrane-targeting loop (C2 M-CBR3) versus EV. Detection of GFP tags using specific antibodies is shown. The wt C2 domain (C2) enhanced cdc42 activity more than C2 M-CBR3 or EV, in PTEN-/- HCT116 cells and Caco-2 ShPTEN cells. (D) Subcellular localization of PTEN C2 domain constructs. Expression of GFP-labeled C2, C2 M-CBR3, and EV is shown in cytosol or membrane fractions of Caco-2 ShPTEN cells, identified using anti-GFP antibody. Expressions of the cytosolic marker tubulin and membrane marker E-cadherin are shown (left panel). C2 versus C2 M-CBR3 expression in total cell lysate is shown to indicate transfection efficiency. Differential gel migration according to size is shown for GFP-C2 and GFP-EV (right panel). (E) Subcellular localization of PTEN C2 domain constructs. Arbitrary densitometry values in Caco-2 ShPTEN cells transfected with GFP-labeled C2 (left two columns) or C2 M-CBR3 (right two columns). Values for accumulation in cytosol and in membrane fractions for C2 versus C2 M-CBR3 were 137 ± 8.5 versus 236 ± 8.7 (cytosol) and 221 ± 4.8 versus 122 ± 7.2 (membrane) [arbitrary densitometry units; P < .001; two-way ANOVA].
Figure 2
Figure 2
Caco-2 and Caco-2 ShPTEN glandular morphogenesis. (A) Progressive Caco-2 glandular morphogenesis. Nuclei were stained in developing glands with DAPI (blue), whereas immunolabeling with anti-E-cadherin (green) and anti-aPKC antibodies was conducted to identify basolateral membrane (green) and AM (red), respectively. Morphology assessments were conducted at 2, 4, and 12 days of culture. A well-formed AM indicated by anti-aPKC immunofluorescence is oriented around single central lumen. (B) Progressive Caco-2 ShPTEN glandular morphogenesis. PTEN-deficient Caco-2 ShPTEN glands showed misorientation of the aPKC AM marker (red) and multiple lumens/vacuoles (arrows) as early as 4 days of culture. (C) Single lumen formation during progressive Caco-2 and Caco-2 ShPTEN glandular morphogenesis. Summary data of single lumen development in Caco-2 and Caco-2 ShPTEN glands (Caco-2 vs Caco-2 ShPTEN after 12 days of culture, 65.5 ± 2.75% vs 38 ± 2.68%; n = 3; P < .01; ANOVA) are shown.
Figure 3
Figure 3
Effects of C2 domain transfections on Caco-2 ShPTEN gland morphogenesis. (A) Effects of C2 domain constructs on Caco-2 ShPTEN morphogenesis at 4 days. Stable transfection of Caco-2 ShPTEN cells with C2 (middle row) but not C2 M-CBR3 (bottom row) or EV (top row) rescued single lumen formation during epithelial morphogenesis. Bright-field FM (BF; first column), FM for GFP (green; second column), or overlay (third column) images are shown; 10 x 0.30 dry objective at x10 magnification. White arrows indicate abnormal lumens. Scale bar, 10 µM. (B) Effects of C2 domain constructs on Caco-2 ShPTEN morphogenesis at 12 days. Caco-2 ShPTEN 3D cultures after stable transfection with GFP-tagged C2 (middle row), C2 M-CBR3 (bottom row), or EV (top row). Confocal midsections of glands imaged for DAPI (blue), E-cadherin (cyan), GFP (green), and aPKC (red) after 12 days of culture. GFP expression (third column) confirms stable transfection with wt or mutant GFP-labeled C2 domain constructs or GFP-labeled EV. White arrows indicate abnormal lumens; 63x 1.40 oil immersion objective at x2 magnification. Scale bar, 10 µM. (C) Effects of C2 domain transfections on Caco-2 ShPTEN single lumen formation at 12 days. Single lumen formation in Caco-2 ShPTEN glands after transfection (EV vs C2 vs C2 M-CBR3 = 43.5 ± 4.0% vs 73.0 ± 4.4% vs 46.0 ± 5.3%; P = .022; ANOVA; n = 3).
Figure 4
Figure 4
NHERF-1 as readout of apical aPKC activity. (A) Effects of aPKC-PSI treatment on p-aPKC in colorectal cells. Limited dose-response assay of aPKC-PSI treatment versus p-aPKC in colorectal cells. In Caco-2 cells, 1 µM aPKC-PSI suppressed p-aPKC. (B) Effects of aPKC-PSI treatment on apical p-aPKC, NHERF-1, and Caco-2 gland morphogenesis. VO-treated Caco-2 glands predominantly formed single central lumens with high apical aPKCζ activity (indicated by p-aPKCζ) and NHERF-1 signal intensity. Treatment with a myristoylated aPKC peptide inhibitor suppressed apical aPKCζ activity (p-aPKCζ; T560) and apical NHERF-1 signal intensity and induced a multilumen phenotype (multiple lumens indicated by white arrows). Scale bar, 10 µM. (C) Effects of aPKC-PSI treatment on p-aPKC and NHERF-1 apical signal intensities. p-aPKC (red) and NHERF-1 (green) signal intensities were assessed in apical domains surrounding the whole circumference of the central lumens of Caco-2 glands treated by VO (DMSO; top panel) or a myristoylated aPKC peptide inhibitor (aPKC-PSI; bottom panel; n = 20 per treatment group). Signal intensities (mean ± SEM) are given as follows: VO-p-aPKC—21.2 ± 0.9; NHERF-1—12.1 ± 0.6; versus aPKC-PSI-p-aPKC—4.6 ± 0.24; NHERF-1—5.7 ± 0.28). Apical p-aPKC and NHERF-1 signal intensities correlated after VO and aPKC-PSI treatments (Pearson correlation = 0.86; P < .001). (D) Effects of aPKC-PSI treatment on Caco-2 gland lumen formation. Single central lumens formed in 64 ± 2.6% Caco-2 glands treated with VO versus 27.5 ± 1.7%(VO) treated with aPKC-PSI (P < .001; one-way ANOVA). (E) Effects of NaBt treatment on PTEN expression. Treatment of Caco-2 or Caco-2 ShPTEN cells with NaBt (1mM) increased PTEN protein expression in untransfected (Ut) Caco-2 cells and in Caco-2 ShPTEN cells after EV transfection (EV) or transfection with the isolated PTEN C2 domain (C2) in expression vectors. (F) Summary effects of NaBt treatment on PTEN protein expression. NaBt treatment enhanced PTEN protein expression in Caco-2 cells versus VO (87.3 ± 4.7 vs 48.7 ± 2.9 arbitrary densitometry units) and in Caco-2 ShPTEN cells after EV (45.0 ± 5.5 vs 21.3 ± 2.0) or C2 transfections (48.7 ± 21 vs 24.3 ± 0.9; P < .001; two-way ANOVA; n = 3). (G) Effects of NaBt treatment on Caco-2 ShPTEN gland morphogenesis. NaBt treatment (bottom panel) enhanced single lumen formation in excess of VO (top panel) in Caco-2 ShPTEN glands. AMs in single and multilumen (white arrows) glands were identified by aPKC and NHERF-1 immunofluorescence. Scale bar, 20 µM. (H) NaBt treatment effects on single lumen formation in Caco-2 ShPTEN glands. Summary effects of NaBt treatment on Caco-2 ShPTEN glandular morphogenesis (percentage of single lumen glands after 12 days of culture; Caco-2 ShPTEN VO = 42.0 ± 1.0 vs NaBt = 69.5 ± 1.5; P < .01; Student's t test).
Figure 5
Figure 5
Histologic grading of CRC. (A) Grade I CRC. Cancers are made up entirely of irregular glands lined by polarized epithelium oriented around distorted central lumens. (B) Grade II CRC. The primary tumor shows gland formation, but >10 clusters of ≥5 cancer cells lacking a gland-like structure (arrows) are observed, through a x4 objective lens, in the stroma. A high-power view of some clusters is shown in the framed inset. (C) Grade III CRC. A POR lacking gland morphology fully occupies the field of a x40 objective lens.
Figure 6
Figure 6
NHERF-1 apical localization in human colon. (A) NHERF-1 apical localization in normal colon. AM localization of NHERF-1 in normal human colon (original magnification, x40). NHERF-1 apical intensity score (mean ± SEM) = 1.55 ± 0.03. (B) NHERF-1 apical localization in CRC (score 3). (C) NHERF-1 apical localization in CRC (score 2). (D) NHERF-1 apical localization in CRC (score 1). (E) NHERF-1 apical localization in CRC (score 0). (F) NHERF-1 apical intensity versus cancer grade. NHERF-1 apical intensity scores are given as follows: grade I CRCs = 0.32 ± 0.06; grade II = 0.204 ± 0.05; grade III = 0.127 ± 0.03 (P = .02; log transformation and hierarchical ANOVA; error bars denote SEM. (G) NHERF-1 apical intensity versus lymph node metastases. Low NHERF-1 apical expression associates with high numbers of involved nodes (error bars denote SEM; P < .01; Kendall ttest).

Similar articles

Cited by

References

    1. Siegel R, Naishadham D, Jemal A. Cancer statistics, 2012. CA Cancer J Clin. 2012;62:10–29. - PubMed
    1. Compton CC, Fielding LP, Burgart LJ, Conley B, Cooper HS, Hamilton SR, Hammond ME, Henson DE, Hutter RV, Nagle RB, et al. Prognostic factors in colorectal cancer. College of American Pathologists Consensus Statement 1999. Arch Pathol Lab Med. 2000;124:979–994. - PubMed
    1. Härmä V, Knuuttila M, Virtanen J, Mirtti T, Kohonen P, Kovanen P, Happonen A, Kaewphan S, Ahonen I, Kallioniemi O, et al. Lysophosphatidic acid and sphingosine-1-phosphate promote morphogenesis and block invasion of prostate cancer cells in three-dimensional organotypic models. Oncogene. 2012;31:2075–2089. - PMC - PubMed
    1. Friedl P, Gilmour D. Collective cell migration in morphogenesis, regeneration and cancer. Nat Rev Mol Cell Biol. 2009;10:445–457. - PubMed
    1. Ueno H, Mochizuki H, Hashiguchi Y, Ishiguro M, Kajiwara Y, Sato T, Shimazaki H, Hase K, Talbot IC. Histological grading of colorectal cancer: a simple and objective method. Ann Surg. 2008;247:811–818. - PubMed

Publication types

MeSH terms