Review
. 2013;9(12):e1003345.
doi: 10.1371/journal.pcbi.1003345. Epub 2013 Dec 12.

Next-generation sequence assembly: four stages of data processing and computational challenges

Affiliations
Review

Next-generation sequence assembly: four stages of data processing and computational challenges

Sara El-Metwally et al. PLoS Comput Biol. 2013.

Abstract

Decoding DNA symbols using next-generation sequencers was a major breakthrough in genomic research. Despite the many advantages of next-generation sequencers, e.g., the high-throughput sequencing rate and relatively low cost of sequencing, the assembly of the reads produced by these sequencers still remains a major challenge. In this review, we address the basic framework of next-generation genome sequence assemblers, which comprises four basic stages: preprocessing filtering, a graph construction process, a graph simplification process, and postprocessing filtering. Here we discuss them as a framework of four stages for data analysis and processing and survey variety of techniques, algorithms, and software tools used during each stage. We also discuss the challenges that face current assemblers in the next-generation environment to determine the current state-of-the-art. We recommend a layered architecture approach for constructing a general assembler that can handle the sequences generated by different sequencing platforms.


Conflict of interest statement

The authors have declared that no competing interests exist.

Figures

Figure 1
Figure 1. Schematic representation of the four stages of the next-generation genome assembly process.
Note: G″ is a simplified version of graph G with N nodes and E edges.
Figure 2
Figure 2. Different approaches for error corrections.
(A) K-spectrum approach: a set of substrings of fixed length k are extracted from the read and ready to filter. (B) Suffix tree/array approach: a set of substrings of different lengths of k (suffixes) are extracted from the read, represented in the suffix tree, and ready to filter. (C) Multiple sequence alignment approach: reads are aligned to each other to define consensus bases and correct erroneous ones.
Figure 3
Figure 3. Overlap-based approach for graph construction.
(A) Overlap graph where nodes are reads and edges are overlaps between them. (B) Example of a Hamiltonian path that visits each node (dotted circles) exactly once in the graph (note: starting node is chosen randomly). (C) Assembled reads corresponding to nodes that are traversed on the Hamiltonian path.
Figure 4
Figure 4. K-spectrum–based approach for graph construction.
(A) de Bruijn graph where the nodes are k-mers and edges are k–1 overlaps between them. (B) Example of an Eulerian path that visits each edge (dotted arrows) exactly once in the graph (note: numbers represent the order of visiting edges). (C) Assembled reads corresponding to the edges that are traversed on the Eulerian path.
Figure 5
Figure 5. Greedy-based approach for graph construction.
(A) Example of a greedy path (dotted arrows) that visits the nodes in the order of maximum overlap length (note: starting node is chosen randomly; at each node the greedy algorithm will choose the next visitor based on the maximum overlap length between this node and its connected neighbors). (B) Assembled reads corresponding to nodes that are traversed on the greedy path.
Figure 6
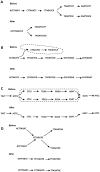
Figure 6. Different graph simplification operations.
(A) Consecutive nodes are merged. (B) Dead end (dotted circle) is removed. (C) Bubble (dotted circle) is simplified where low-coverage path of the two paths that caused it was removed. (D) X-cut is simplified by splitting the connections into two parallel paths.
Figure 7
Figure 7. Building scaffolds using contig connectivity graph.
(A) Paired-end reads are aligned to contigs and their orientations are determined. (B) The library insert size (dotted line) is determined between two pairs and compared with the one saved previously. (C) Contig connectivity graph is constructed and filtered according to paired-end constraints.
Figure 8
Figure 8. N50 calculation method.
(A) Set of contigs with their length. (B) Contigs are sorted in descending order. (C) Lengths of all contigs are added (20+15+10+5+2 = 52 kb) and divided by 2 (52/2 = 26 kb). (D) Lengths are added again until the sum exceeds 26 kb, and hence exceeds 50% of the total length of all contigs: 20+15 = 35 kb≥26; then, N50 is the last added contig, which is 15 kb.
Figure 9
Figure 9. The proposed layered architecture for building a general assembler (dotted circle).
This architecture has two basic layers: presentation and assembly layers. The presentation layer accepts the data from the user and outputs the assembly results through a set of user interface components. It is also responsible for converting platform-specific files to a unified file format for the underlying processing layers. The assembly layer contains three basic services: preprocessing filtering, assembly, and postprocessing filtering, which are provided through the four stages of the data processing layer. These services are supported through a set of communicated interfaces corresponding to each sequencing platform.

References

    1. Niedringhaus TP, Milanova D, Kerby MB, Snyder MP, Barron AE (2011) Landscape of next-generation sequencing technologies. Anal Chem 83: 4327–4341. - PMC - PubMed
    1. Voelkerding KV, Dames SA, Durtschi JD (2009) Next-generation sequencing: from basic research to diagnostics. Clin Chem 55: 641–658. - PubMed
    1. Helmy M, Sugiyama N, Tomita M, Ishihama Y (2012) Mass spectrum sequential subtraction speeds up searching large peptide MS/MS spectra datasets against large nucleotide databases for proteogenomics. Genes Cells 17: 633–644. - PubMed
    1. Helmy M, Tomita M, Ishihama Y (2011) Peptide identification by searching large-scale tandem mass spectra against large databases: bioinformatics methods in proteogenomics. Genes, Genomes and Genomics 6: 76–85.
    1. Zhou X, Ren L, Meng Q, Li Y, Yu Y, et al. (2010) The next-generation sequencing technology and application. Protein Cell 1: 520–536. - PMC - PubMed

Publication types