

Amino acid changes in disease-associated variants differ radically from variants observed in the 1000 genomes project dataset
- PMID: 24348229
- PMCID: PMC3861039
- DOI: 10.1371/journal.pcbi.1003382
Amino acid changes in disease-associated variants differ radically from variants observed in the 1000 genomes project dataset
Abstract
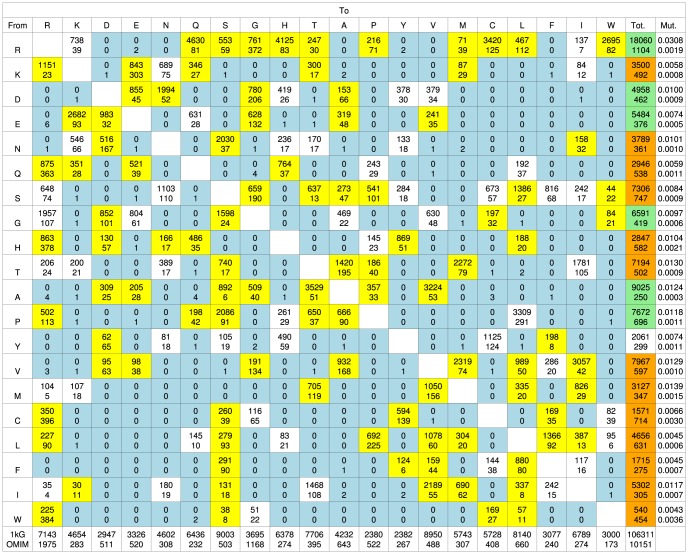
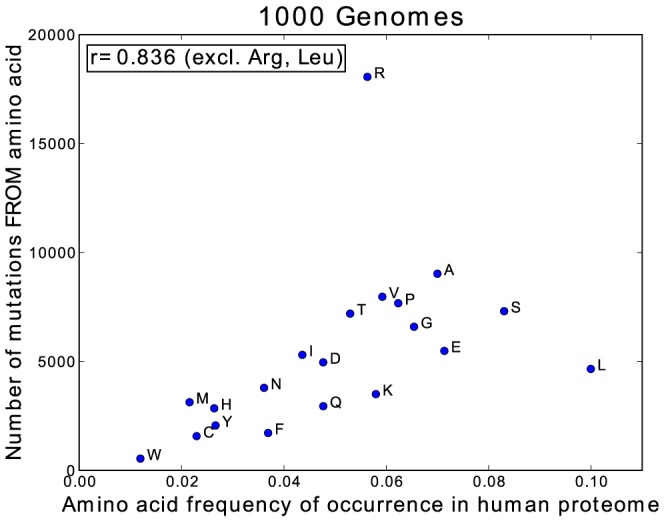
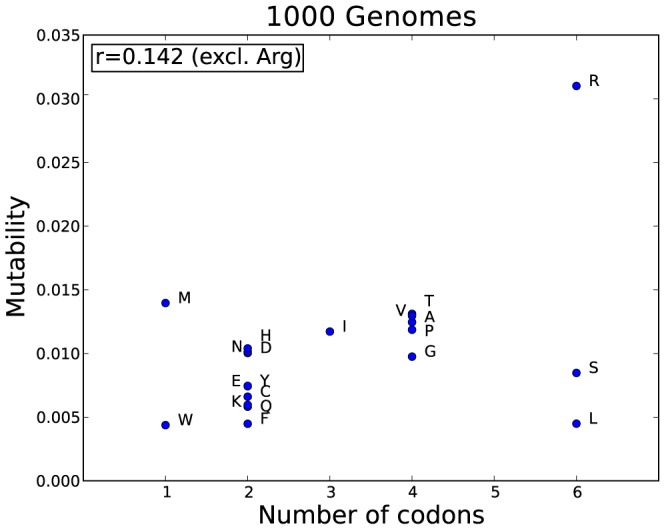
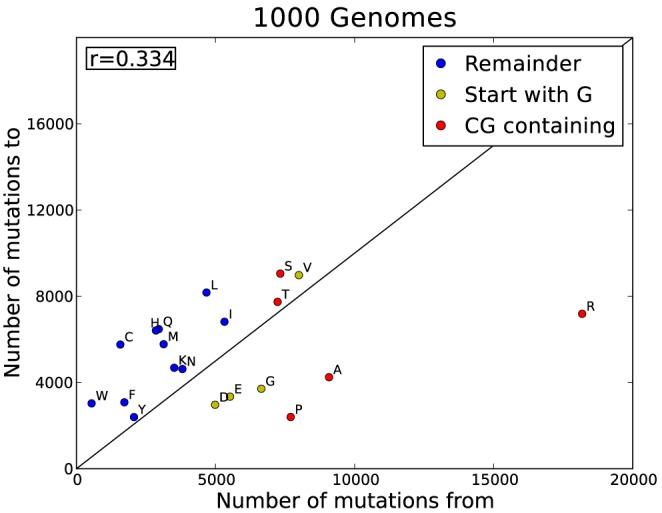
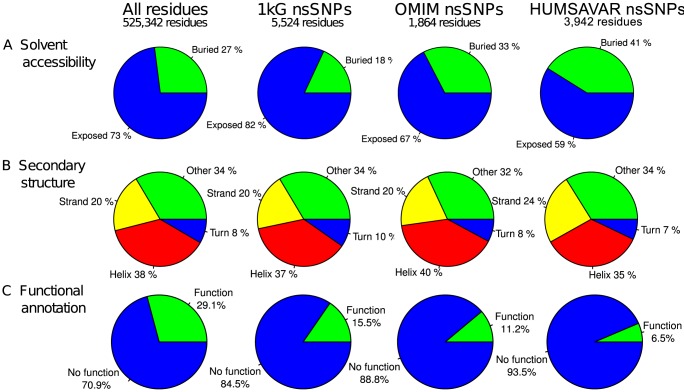
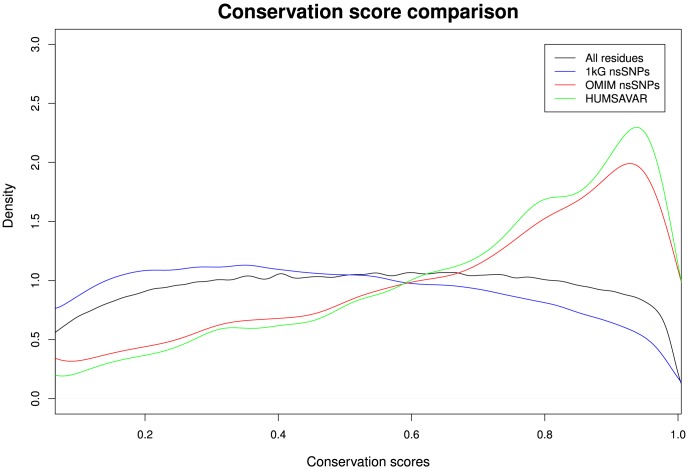
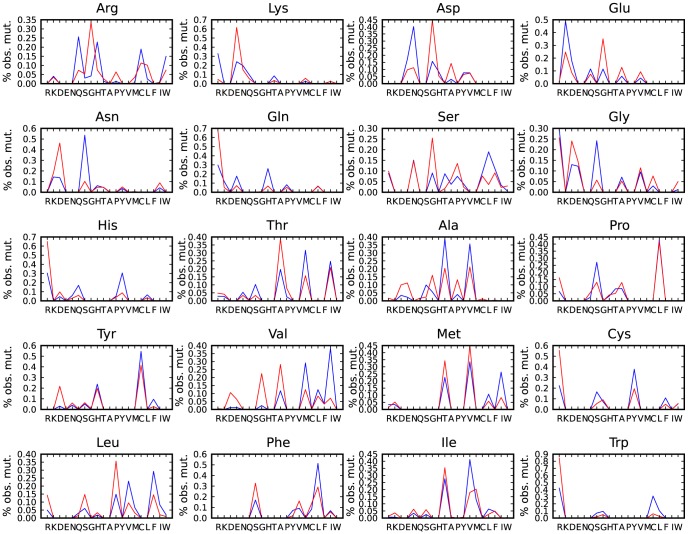
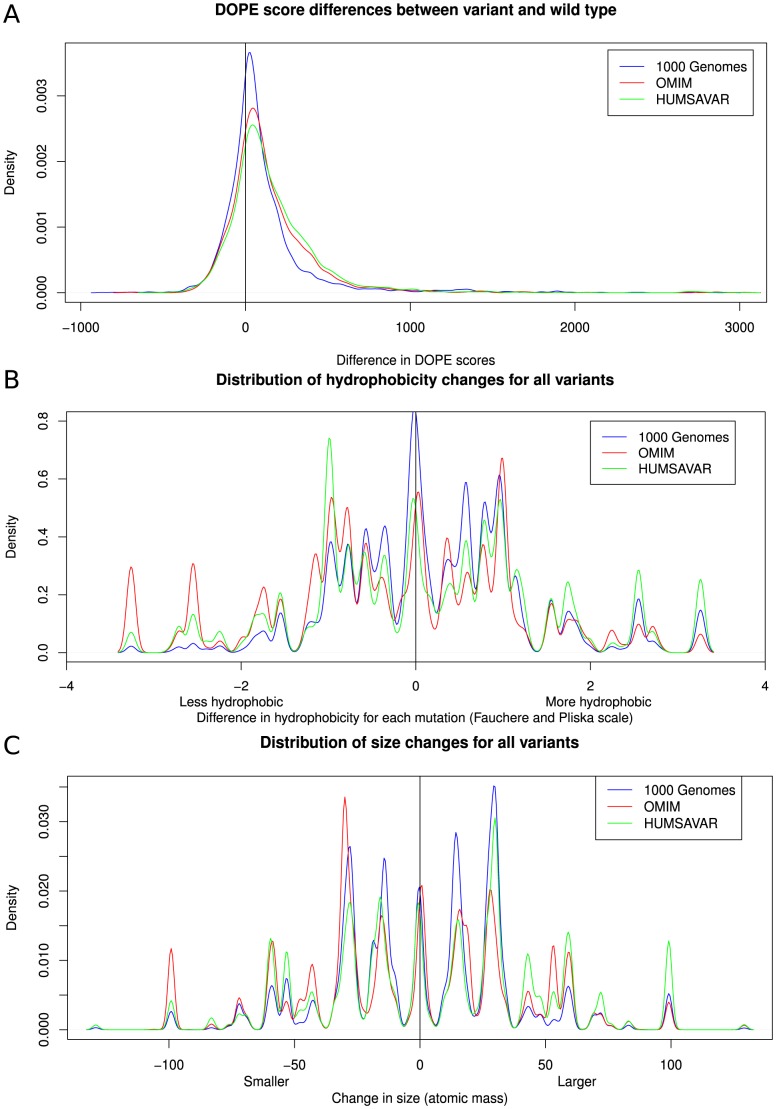
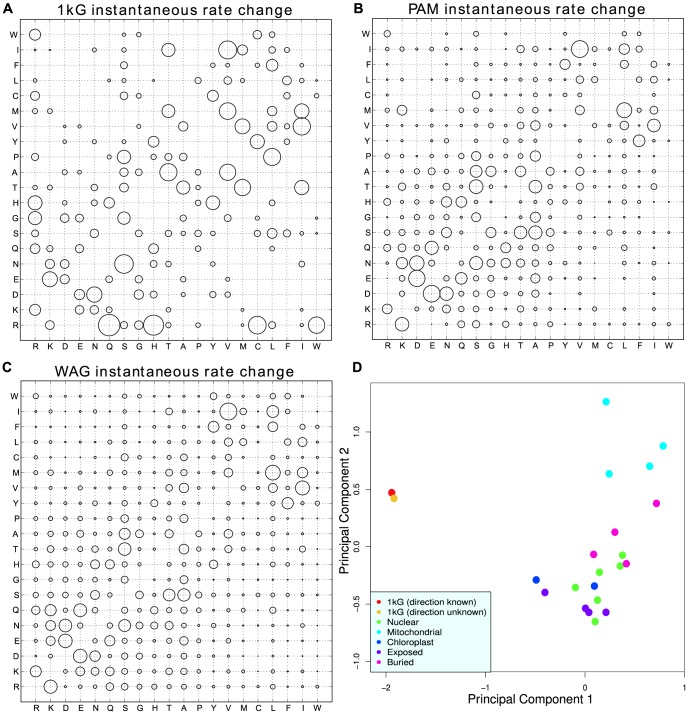
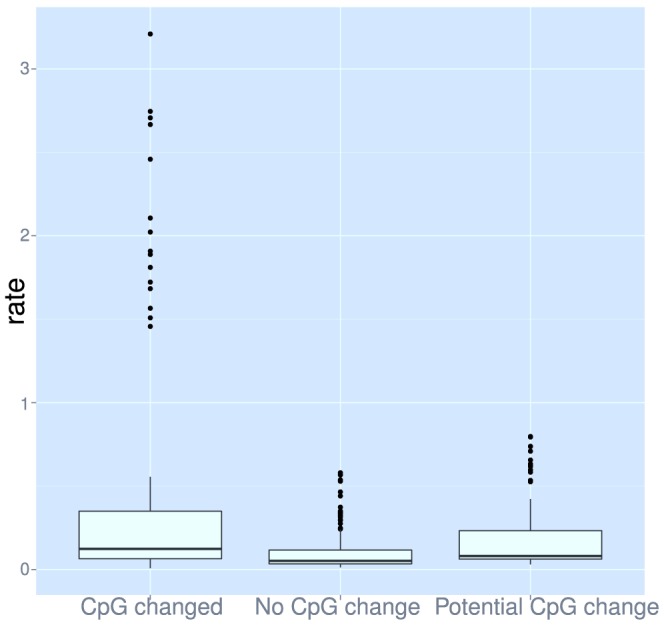
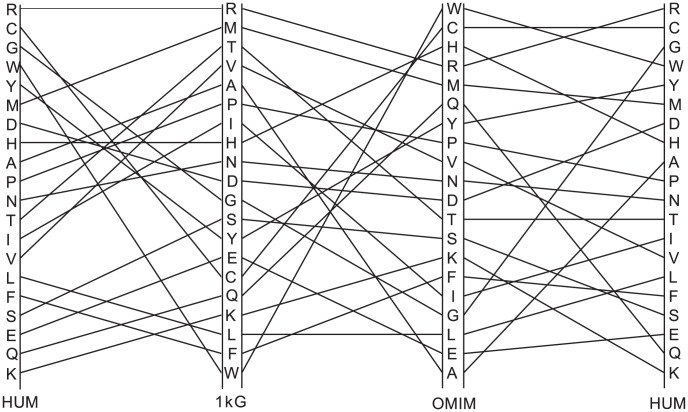
The 1000 Genomes Project data provides a natural background dataset for amino acid germline mutations in humans. Since the direction of mutation is known, the amino acid exchange matrix generated from the observed nucleotide variants is asymmetric and the mutabilities of the different amino acids are very different. These differences predominantly reflect preferences for nucleotide mutations in the DNA (especially the high mutation rate of the CpG dinucleotide, which makes arginine mutability very much higher than other amino acids) rather than selection imposed by protein structure constraints, although there is evidence for the latter as well. The variants occur predominantly on the surface of proteins (82%), with a slight preference for sites which are more exposed and less well conserved than random. Mutations to functional residues occur about half as often as expected by chance. The disease-associated amino acid variant distributions in OMIM are radically different from those expected on the basis of the 1000 Genomes dataset. The disease-associated variants preferentially occur in more conserved sites, compared to 1000 Genomes mutations. Many of the amino acid exchange profiles appear to exhibit an anti-correlation, with common exchanges in one dataset being rare in the other. Disease-associated variants exhibit more extreme differences in amino acid size and hydrophobicity. More modelling of the mutational processes at the nucleotide level is needed, but these observations should contribute to an improved prediction of the effects of specific variants in humans.
Conflict of interest statement
The authors have declared that no competing interests exist.
Figures
Similar articles
-
A protein evolution model with independent sites that reproduces site-specific amino acid distributions from the Protein Data Bank.BMC Evol Biol. 2006 May 31;6:43. doi: 10.1186/1471-2148-6-43. BMC Evol Biol. 2006. PMID: 16737532 Free PMC article.
-
The amino-acid mutational spectrum of human genetic disease.Genome Biol. 2003;4(11):R72. doi: 10.1186/gb-2003-4-11-r72. Epub 2003 Oct 30. Genome Biol. 2003. PMID: 14611658 Free PMC article.
-
Correlations between nucleotide frequencies and amino acid composition in 115 bacterial species.Biochem Biophys Res Commun. 2004 Mar 19;315(4):1097-103. doi: 10.1016/j.bbrc.2004.01.129. Biochem Biophys Res Commun. 2004. PMID: 14985126
-
An estimate on the effect of point mutation and natural selection on the rate of amino acid replacement in proteins.J Mol Evol. 1984-1985;21(3):233-57. doi: 10.1007/BF02102357. J Mol Evol. 1984. PMID: 6443130
-
Structural analysis of human apolipoprotein A-I variants. Amino acid substitutions are nonrandomly distributed throughout the apolipoprotein A-I primary structure.J Biol Chem. 1990 May 25;265(15):8610-7. J Biol Chem. 1990. PMID: 2111322
Cited by
-
Exploring Novel Variants of the Cytochrome P450 Reductase Gene (POR) from the Genome Aggregation Database by Integrating Bioinformatic Tools and Functional Assays.Biomolecules. 2023 Nov 30;13(12):1728. doi: 10.3390/biom13121728. Biomolecules. 2023. PMID: 38136599 Free PMC article.
-
Types and effects of protein variations.Hum Genet. 2015 Apr;134(4):405-21. doi: 10.1007/s00439-015-1529-6. Epub 2015 Jan 24. Hum Genet. 2015. PMID: 25616435
-
Compensatory epistasis explored by molecular dynamics simulations.Hum Genet. 2021 Sep;140(9):1329-1342. doi: 10.1007/s00439-021-02307-x. Epub 2021 Jun 26. Hum Genet. 2021. PMID: 34173867
-
VarMeter2: An enhanced structure-based method for predicting pathogenic missense variants through Mahalanobis distance.Comput Struct Biotechnol J. 2025 Mar 1;27:1034-1047. doi: 10.1016/j.csbj.2025.02.008. eCollection 2025. Comput Struct Biotechnol J. 2025. PMID: 40160862 Free PMC article.
-
Insights into Disease-Associated Mutations in the Human Proteome through Protein Structural Analysis.Structure. 2015 Jul 7;23(7):1362-9. doi: 10.1016/j.str.2015.03.028. Epub 2015 May 28. Structure. 2015. PMID: 26027735 Free PMC article.
References
Publication types
MeSH terms
Substances
Grants and funding
LinkOut - more resources
Full Text Sources
Other Literature Sources
