. 2013;9(12):e1003392.
doi: 10.1371/journal.pcbi.1003392. Epub 2013 Dec 12.

Inferring developmental stage composition from gene expression in human malaria

Affiliations

Inferring developmental stage composition from gene expression in human malaria

Regina Joice et al. PLoS Comput Biol. 2013.

Abstract

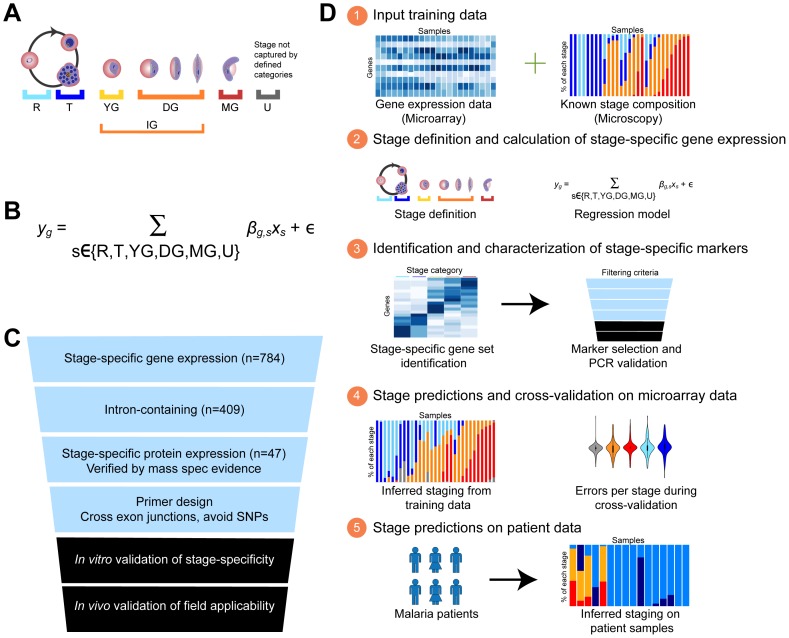
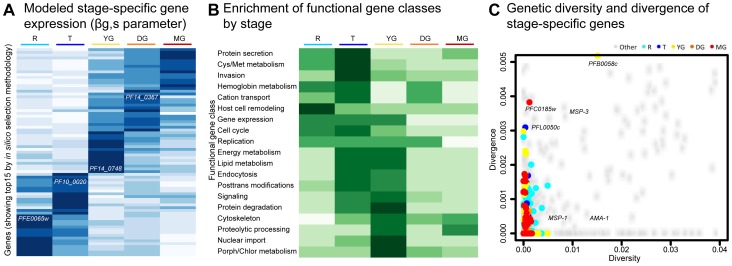
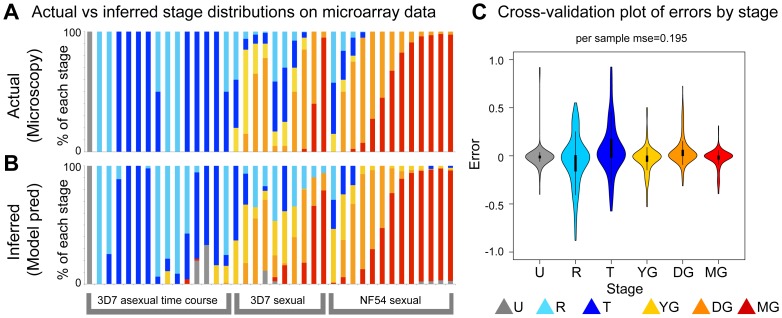
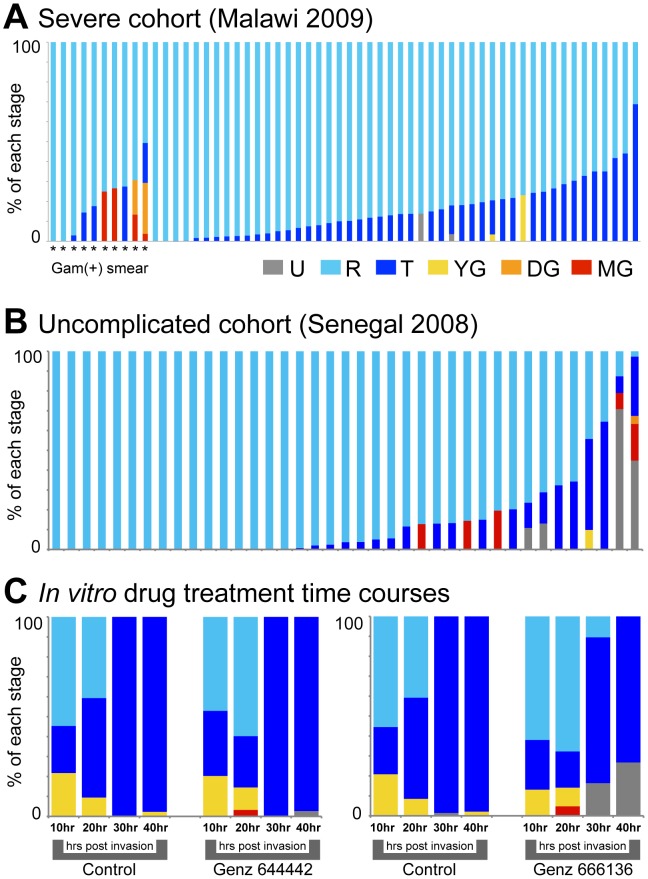
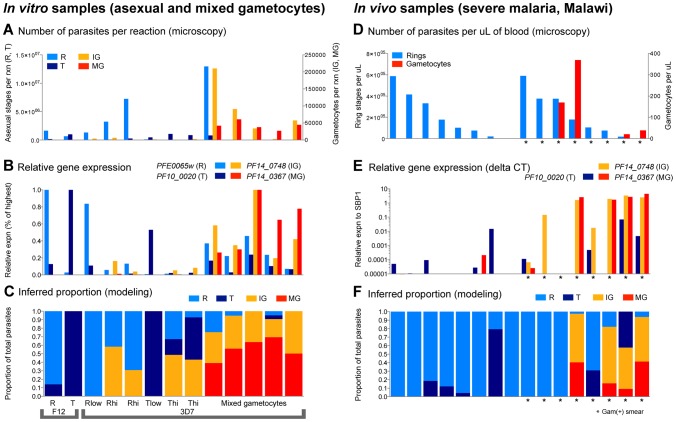
In the current era of malaria eradication, reducing transmission is critical. Assessment of transmissibility requires tools that can accurately identify the various developmental stages of the malaria parasite, particularly those required for transmission (sexual stages). Here, we present a method for estimating relative amounts of Plasmodium falciparum asexual and sexual stages from gene expression measurements. These are modeled using constrained linear regression to characterize stage-specific expression profiles within mixed-stage populations. The resulting profiles were analyzed functionally by gene set enrichment analysis (GSEA), confirming differentially active pathways such as increased mitochondrial activity and lipid metabolism during sexual development. We validated model predictions both from microarrays and from quantitative RT-PCR (qRT-PCR) measurements, based on the expression of a small set of key transcriptional markers. This sufficient marker set was identified by backward selection from the whole genome as available from expression arrays, targeting one sentinel marker per stage. The model as learned can be applied to any new microarray or qRT-PCR transcriptional measurement. We illustrate its use in vitro in inferring changes in stage distribution following stress and drug treatment and in vivo in identifying immature and mature sexual stage carriers within patient cohorts. We believe this approach will be a valuable resource for staging lab and field samples alike and will have wide applicability in epidemiological studies of malaria transmission.


Conflict of interest statement

The authors have declared that no competing interests exist.

Figures

Figure 1
Figure 1. In silico dissection approach developing a linear regression model to identify stage-specific gene expression profiles within bulk parasite population gene expression.
(A) Definition of physiologically relevant stage categories within P. falciparum development for which we will identify stage-specific expression signatures. Stages are as follows: R: asexual ring, T: asexual trophozoite and schizont, YG: young gametocyte ring and stage I, DG: developing gametocyte stages II, III, and IV, IG: all immature gametocytes (YG+DG), MG: mature gametocyte stage V, and U: unexpected profile not captured by our defined stages. (B) Linear regression model for the deconvolution of bulk gene expression data from mixed stage samples. Terms are as follows: yg: total expression of gene g, βg,s: expression of gene g attributed to stage s, Xs: proportion of the sample that is stage s. (C) Marker Selection. Filters used to narrow down gene sets to our set of sentinel markers for field-applicable qRT-PCR assay. As we chose markers for ring and trophozoite/schizont stages a priori based on published stage-specific gene expression data for asexual development , , , we used this selection method to identify markers for the remaining gametocyte stage categories. (D) Overall stage prediction schematic.
Figure 2
Figure 2. Stage-predictive gene sets are enriched for specific biological processes but show no signature of selection by diversity/divergence measures.
(A) Top 15 model βg,s parameters specific to each stage; values indicate for each gene the degree of its expression attributed to each stage. (B) Gene set enrichments of GO and KEGG processes by stage (Supplementary Table S2). (C) Genetic diversity (within patient) vs. divergence (between isolate) of the P. falciparum genome (see Methods for data sources), highlighting genes identified as stage-specific. Several known markers are labeled for reference.
Figure 3
Figure 3. Marker selection yields a set of sentinel markers with high predictive accuracy.
(A) Actual and (B) inferred stage distributions across five microarray time courses (two asexual and three sexual) with reference stage distributions determined by microscopy. Six markers were used to make these predictions, five as identified through filtering criteria (Table 1) and the previously established mature gametocyte marker Pfs25. (C). Bootstrap cross-validation of error rates expected per stage in model inferences. Violin plots show expected density, with internal boxplots detailing the 25th–75th percentiles and 1.5× fences.
Figure 4
Figure 4. Application of microarray model to malaria patient cohorts and drug perturbation time courses.
(A) Model inferences for 58 pediatric severe malaria patients from Blantyre, Malawi. Stars indicate subjects in which at least one gametocyte was observed by thick smear examination, a particularly sensitive assay (14 patients). (B) Model inferences for 39 adult uncomplicated patient samples from Dakar, Senegal. (C) Model inferences for in vitro time course experiments in which samples were taken at 10, 20, 30, and 40 hours post-invasion. Time courses were performed in the presence of one of two antimalarial compounds, Genz-666136 and Genz-644442, or under normal growth conditions (control).
Figure 5
Figure 5. qRT-PCR assay optimization.
(A) We collected and analyzed a range of in vitro time points with varying contributions of asexual and sexual stages, from both gametocyte-producing and non-producing lines of 3D7. Absolute number of parasites stages that went into each qRT-PCR reaction well is plotted. (B) Relative qRT-PCR-based gene expression of stage-specific markers for R, T, IG and MG are shown for time points corresponding vertically to those in part A. (C) Inferred proportion of each stage in the total parasite load (model predictions) are shown corresponding vertically to the time points in A and B, plotted as a percentage of total parasites in that sample. (D) In vivo peripheral blood samples from severe malaria patients in Blantyre, Malawi were collected and analyzed. Absolute numbers of parasites stages per µL of blood, as determined by microscopy, are plotted. (E) Relative qRT-PCR-based gene expression of stage-specific markers for T, IG and MG (normalized to SBP1) is shown for time points corresponding vertically to those in part D. (F) Inferred proportion of each stage (model predictions) are shown corresponding vertically to the time points in D and E. Stars indicate subjects in which gametocytes were observed by highly sensitive thick smear examination (one or more gametocytes in 100 high power fields).

References

    1. Alonso PL, Brown G, Arevalo-Herrera M, Binka F, Chitnis C, et al. A research agenda to underpin malaria eradication. PLoS Med 8: e1000406. - PMC - PubMed
    1. Alano P (2007) Plasmodium falciparum gametocytes: still many secrets of a hidden life. Mol Microbiol 66: 291–302. - PubMed
    1. Young JA, Fivelman QL, Blair PL, de la Vega P, Le Roch KG, et al. (2005) The Plasmodium falciparum sexual development transcriptome: a microarray analysis using ontology-based pattern identification. Mol Biochem Parasitol 143: 67–79. - PubMed
    1. Bozdech Z, Llinas M, Pulliam BL, Wong ED, Zhu J, et al. (2003) The transcriptome of the intraerythrocytic developmental cycle of Plasmodium falciparum. PLoS Biol 1: E5. - PMC - PubMed
    1. Le Roch KG, Zhou Y, Blair PL, Grainger M, Moch JK, et al. (2003) Discovery of gene function by expression profiling of the malaria parasite life cycle. Science 301: 1503–1508. - PubMed

Publication types