. 2013;9(12):e1003797.
doi: 10.1371/journal.ppat.1003797. Epub 2013 Dec 12.

Enterohemorrhagic Escherichia coli hemolysin employs outer membrane vesicles to target mitochondria and cause endothelial and epithelial apoptosis

Affiliations

Enterohemorrhagic Escherichia coli hemolysin employs outer membrane vesicles to target mitochondria and cause endothelial and epithelial apoptosis

Martina Bielaszewska et al. PLoS Pathog. 2013.

Abstract

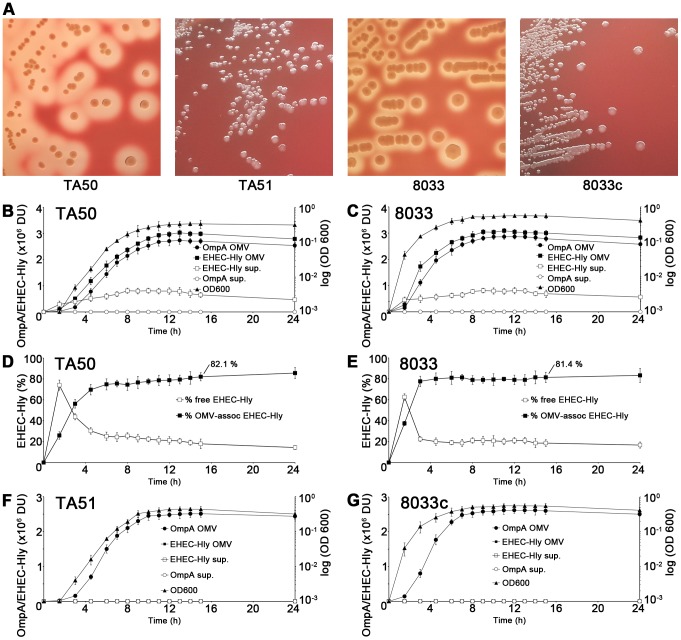
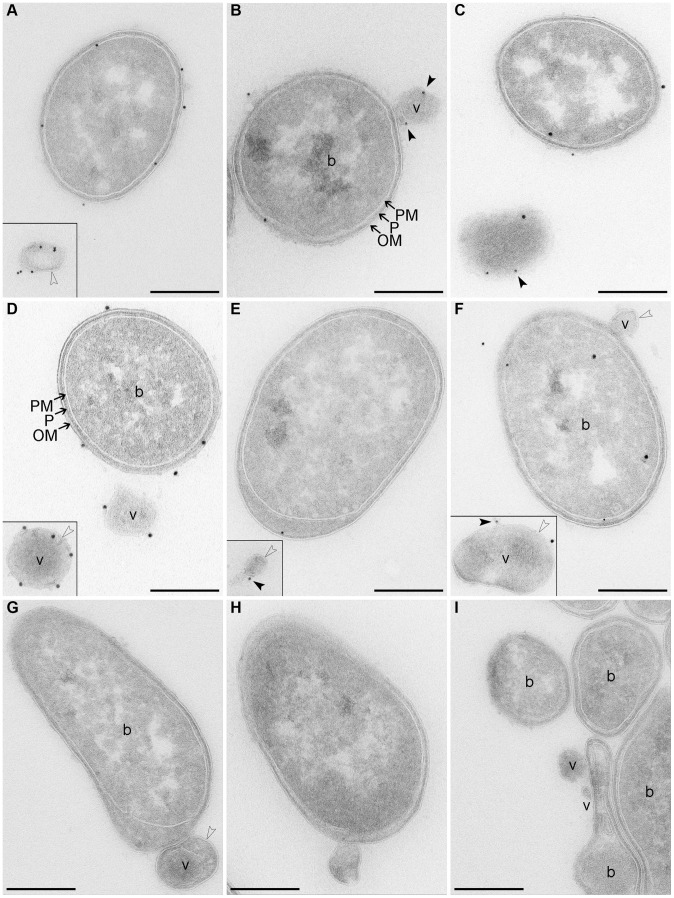
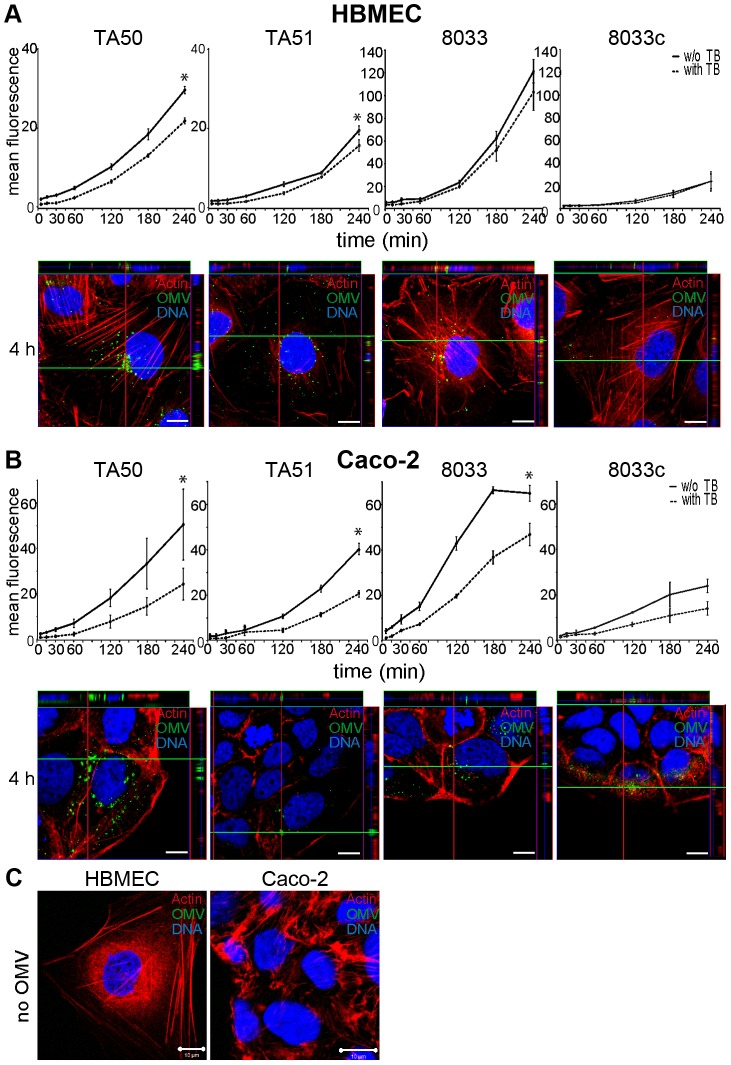
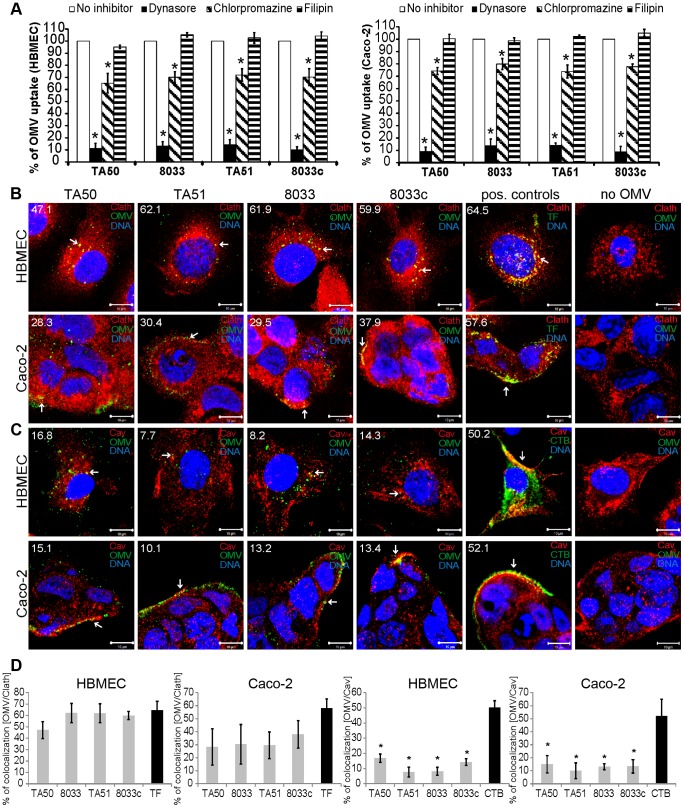
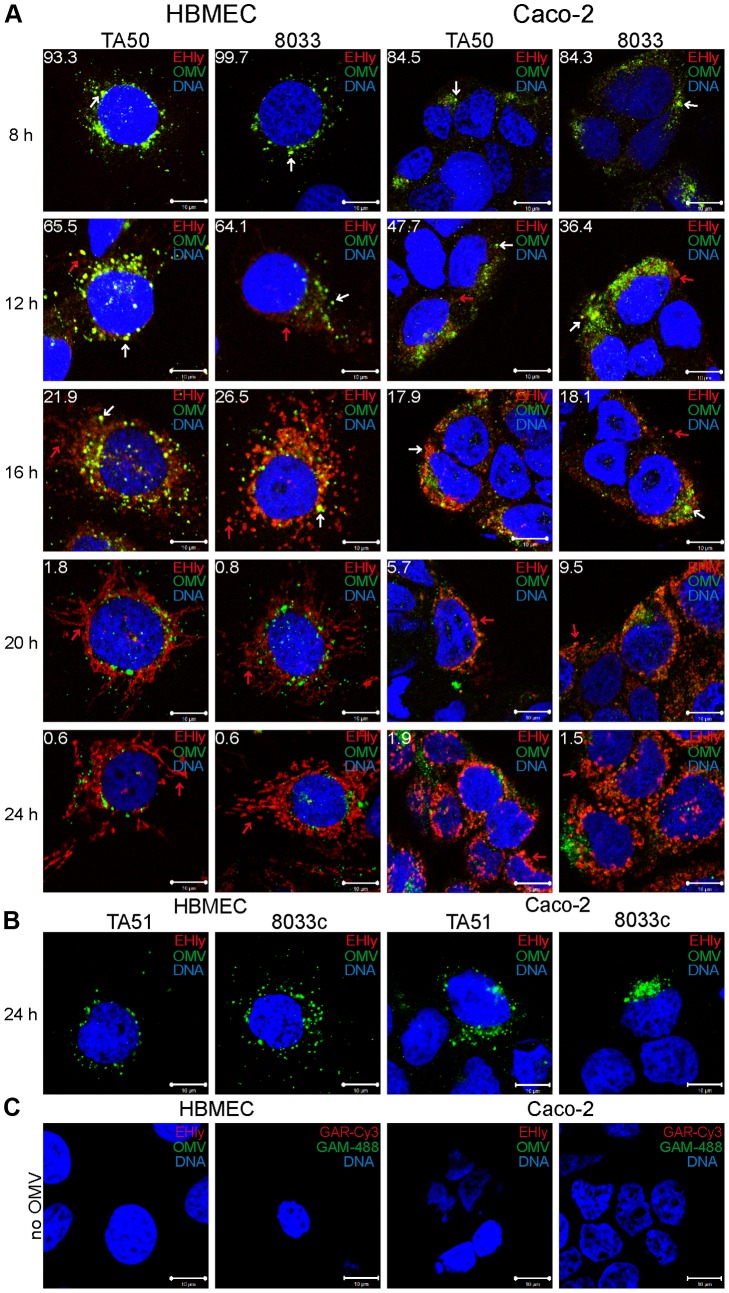
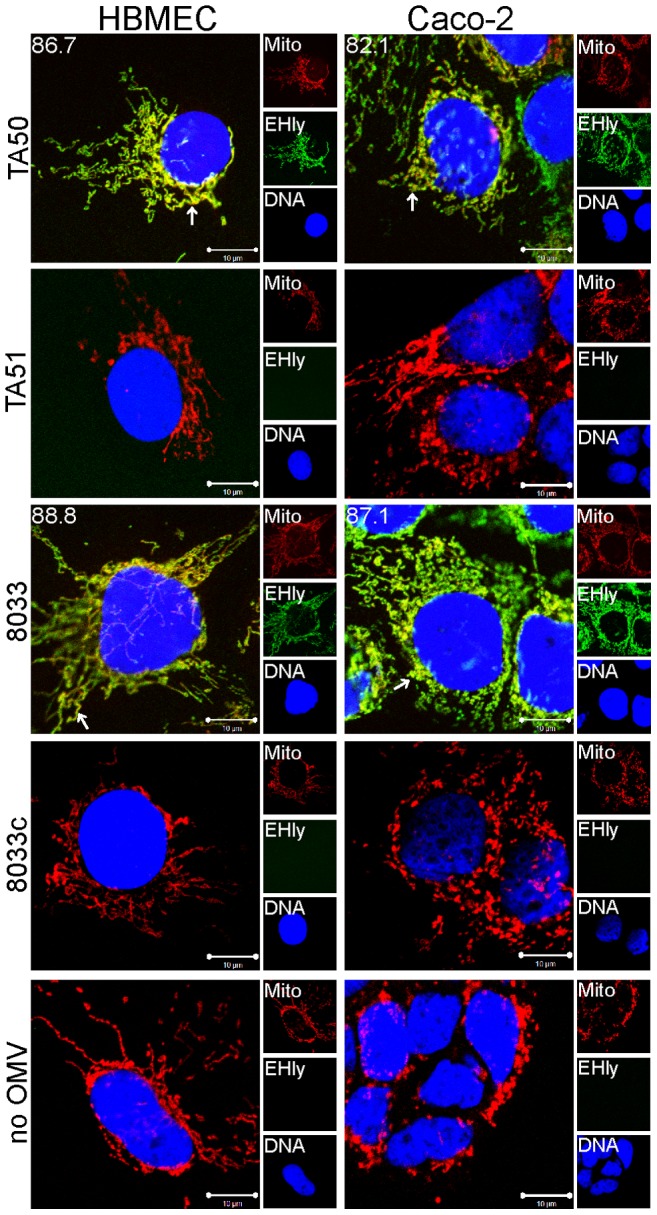
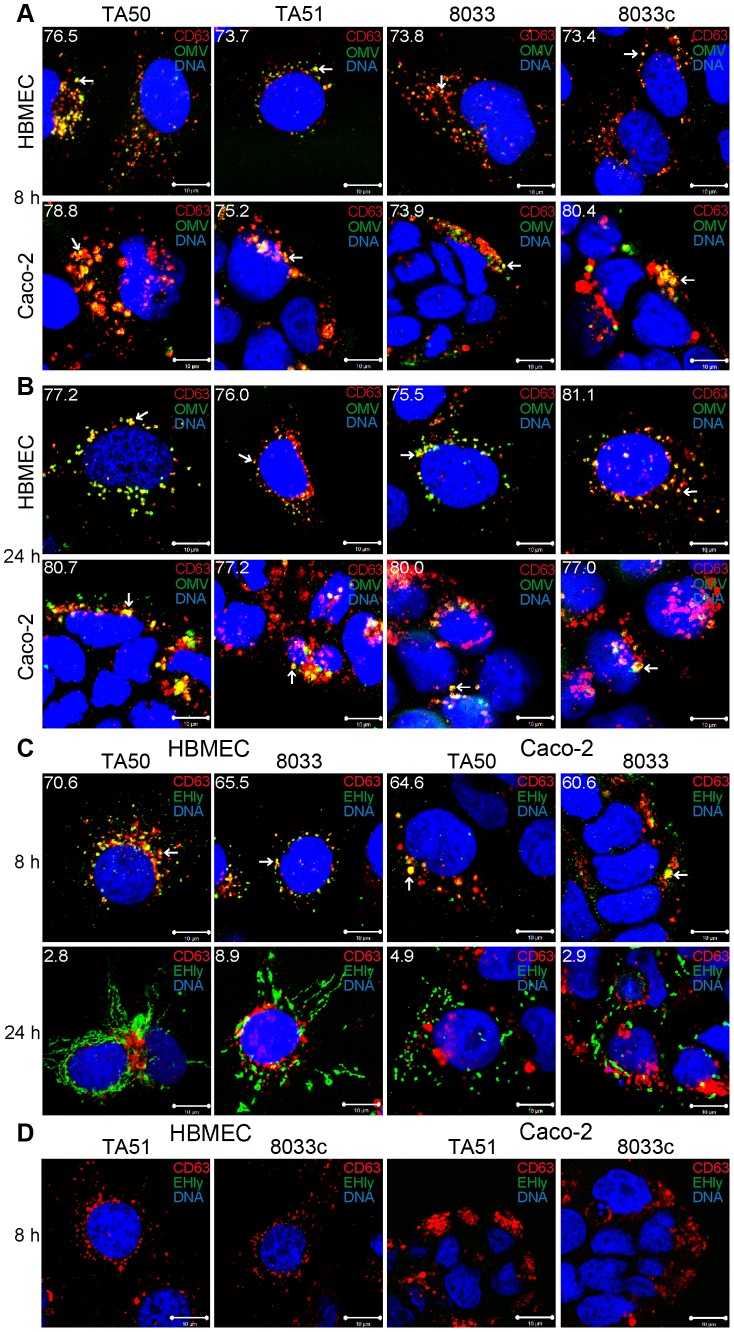
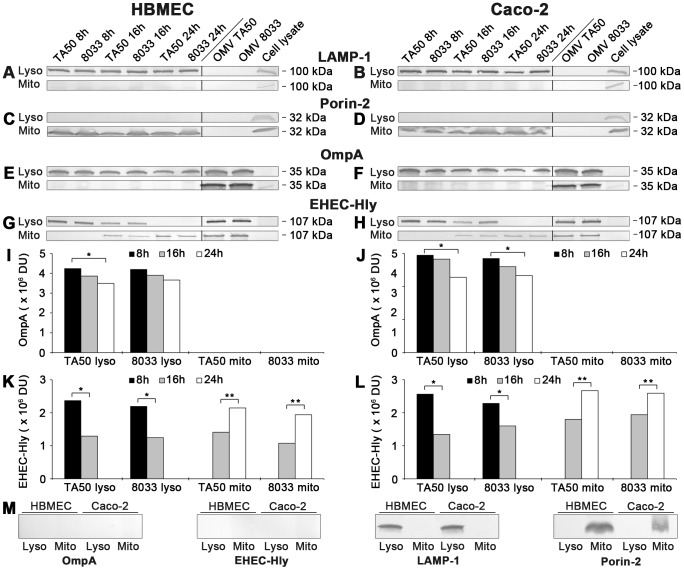
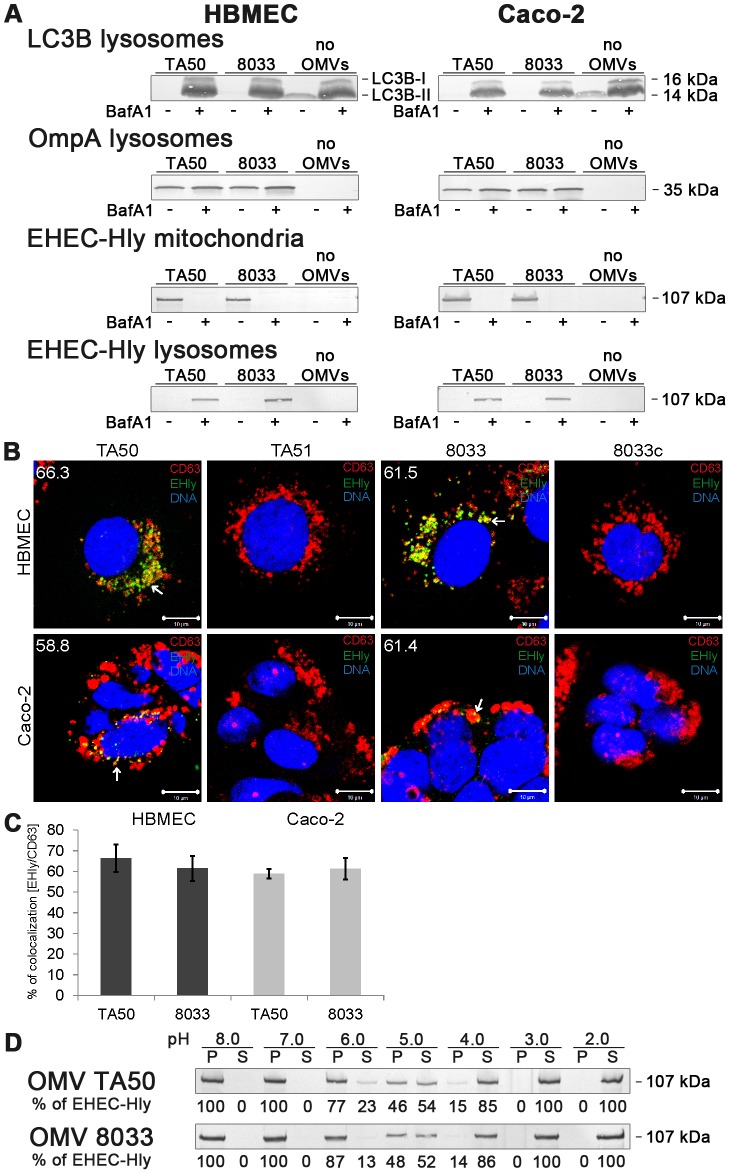
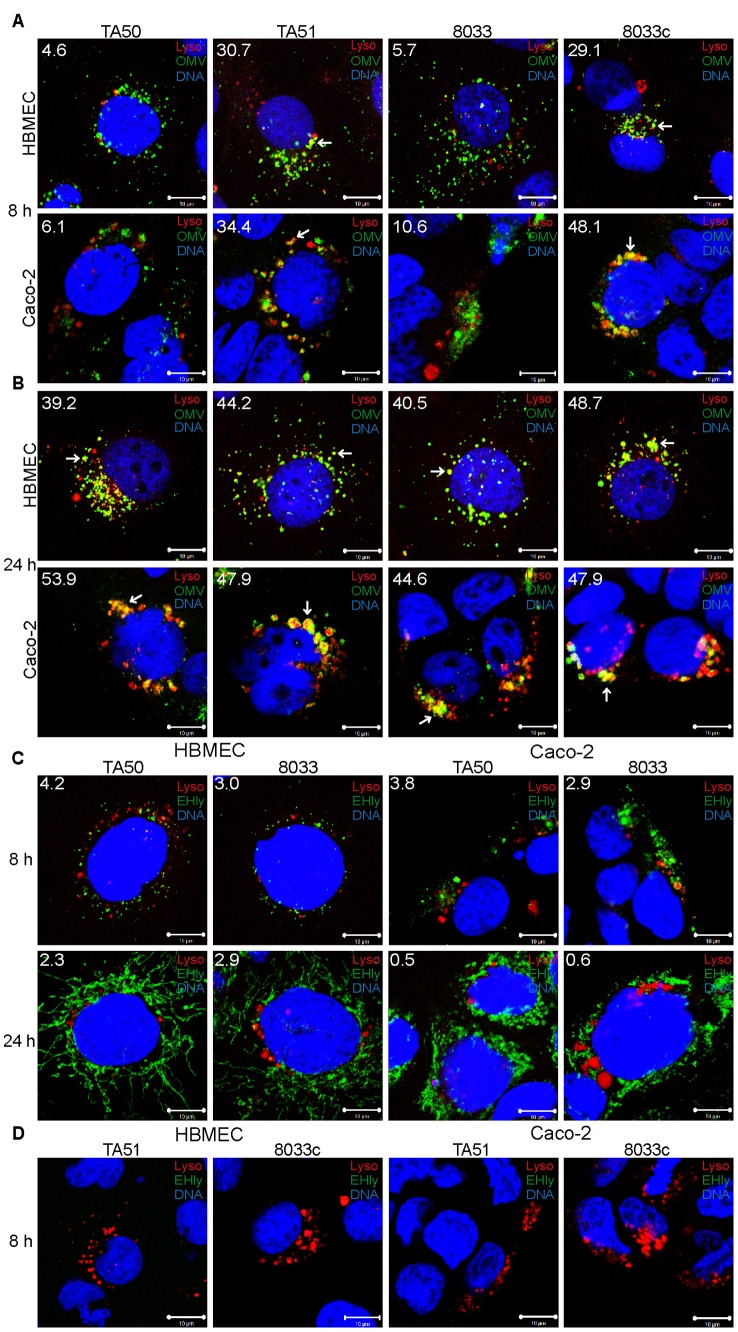
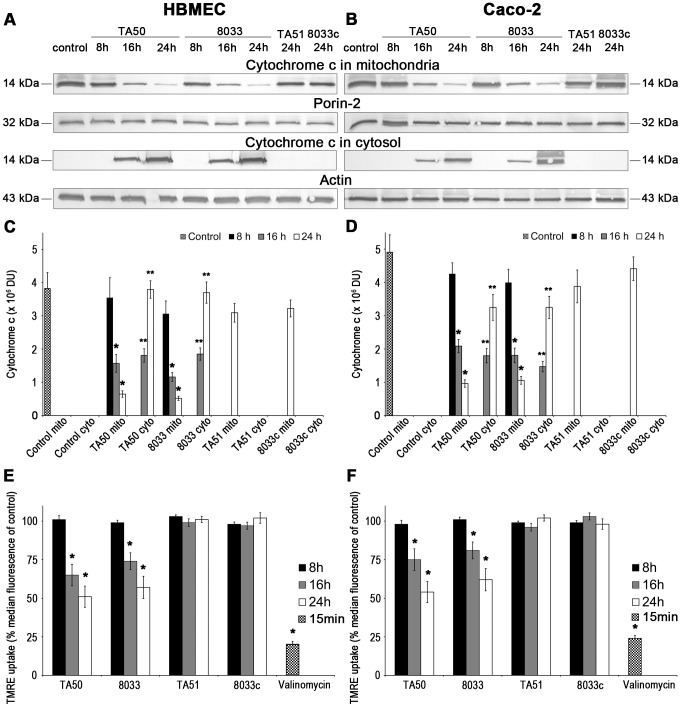
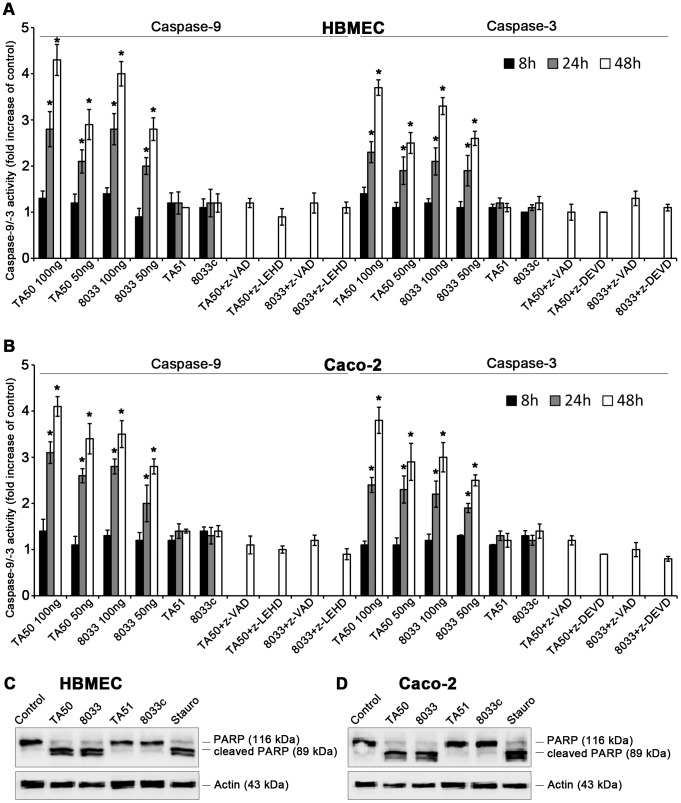
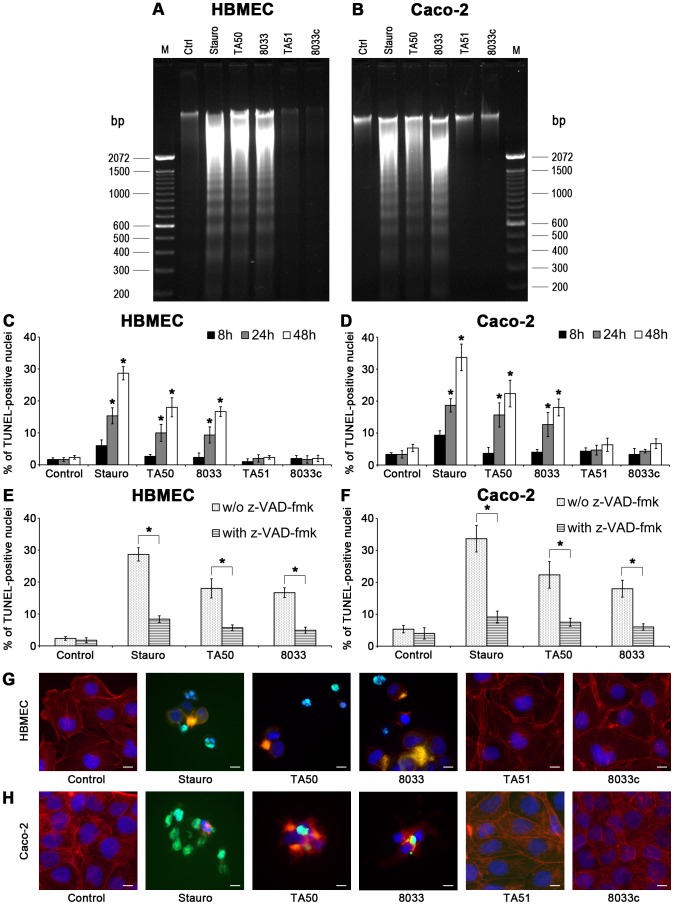
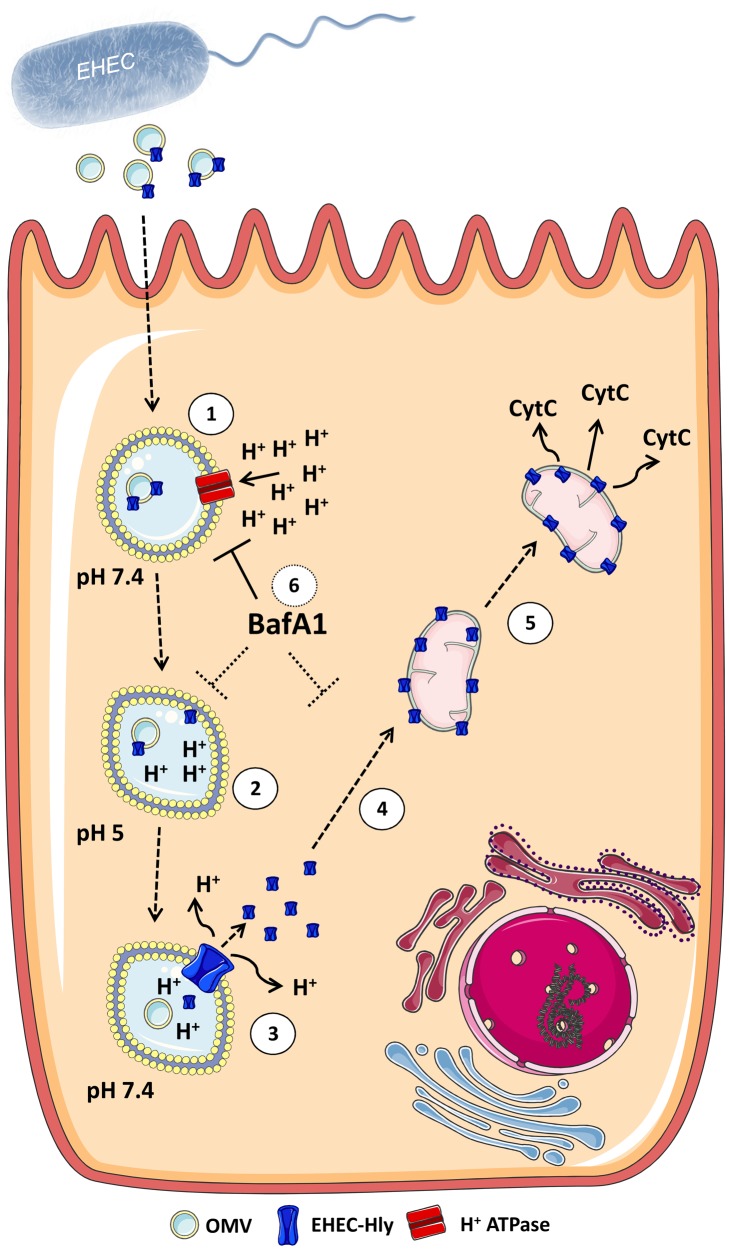
Enterohemorrhagic Escherichia coli (EHEC) strains cause diarrhea and hemolytic uremic syndrome resulting from toxin-mediated microvascular endothelial injury. EHEC hemolysin (EHEC-Hly), a member of the RTX (repeats-in-toxin) family, is an EHEC virulence factor of increasingly recognized importance. The toxin exists as free EHEC-Hly and as EHEC-Hly associated with outer membrane vesicles (OMVs) released by EHEC during growth. Whereas the free toxin is lytic towards human endothelium, the biological effects of the OMV-associated EHEC-Hly on microvascular endothelial and intestinal epithelial cells, which are the major targets during EHEC infection, are unknown. Using microscopic, biochemical, flow cytometry and functional analyses of human brain microvascular endothelial cells (HBMEC) and Caco-2 cells we demonstrate that OMV-associated EHEC-Hly does not lyse the target cells but triggers their apoptosis. The OMV-associated toxin is internalized by HBMEC and Caco-2 cells via dynamin-dependent endocytosis of OMVs and trafficked with OMVs into endo-lysosomal compartments. Upon endosome acidification and subsequent pH drop, EHEC-Hly is separated from OMVs, escapes from the lysosomes, most probably via its pore-forming activity, and targets mitochondria. This results in decrease of the mitochondrial transmembrane potential and translocation of cytochrome c to the cytosol, indicating EHEC-Hly-mediated permeabilization of the mitochondrial membranes. Subsequent activation of caspase-9 and caspase-3 leads to apoptotic cell death as evidenced by DNA fragmentation and chromatin condensation in the intoxicated cells. The ability of OMV-associated EHEC-Hly to trigger the mitochondrial apoptotic pathway in human microvascular endothelial and intestinal epithelial cells indicates a novel mechanism of EHEC-Hly involvement in the pathogenesis of EHEC diseases. The OMV-mediated intracellular delivery represents a newly recognized mechanism for a bacterial toxin to enter host cells in order to target mitochondria.


Conflict of interest statement

The authors have declared that no competing interests exist.

Figures

Figure 1
Figure 1. Hemolytic phenotypes and kinetics of EHEC-Hly secretion, OMV production and EHEC-Hly-OMV association in strains used in this study.
(A) Strains were grown on enterohemolysin agar for 24 h at 37°C and the plates were examined for hemolysis. Colonies of EHEC-Hly-producing strains TA50 and 8033 are surrounded by zones of hemolysis, whereas no hemolysis is present around colonies of EHEC-Hly-negative strains TA51 and 8033c. The relative contribution of free and OMV-associated EHEC-Hly to hemolysis observed on enterohemolysin agar is unknown. (B, C, F, G) EHEC-Hly-producing strains TA50 (B) and 8033 (C) and EHEC-Hly-negative strains TA51 (F) and 8033c (G) were grown in 1 l of LB broth for 24 h. At each time point of 1.5 h, 3 h, 4.5 h, 6 h to 15 h, and 24 h a 50 ml aliquot of each culture was collected, bacteria were removed by centrifugation and supernatants were sterile filtered. OMVs were pelleted from the filtered supernatants by ultracentrifugation and proteins from supernatants after ultracentrifugation were precipitated with 10% TCA. After resuspending in 100 µl of 20 mM TRIS-HCl, aliquots (9 µl) of the OMV fractions and TCA-precipitated supernatants were separated by SDS-PAGE, immunoblotted with anti-EHEC-Hly or anti-OmpA antibody, and signals were quantified densitometrically and expressed in arbitrary densitometric units (DU). Bacterial growth was monitored by measuring the optical density of the cultures at 600 nm (OD600) at each time. (D, E) The percentage of EHEC-Hly associated with OMVs in strains TA50 (D) and 8033 (E) at each time interval was calculated as the percentage of the densitometric signal of OMV-associated EHEC-Hly from the total EHEC-Hly signal (i.e. the sum of OMV-associated and free EHEC-Hly signals). Data in panels B-G are expressed as means ± standard deviations from three independent experiments.
Figure 2
Figure 2. Electron microscopy of OMV-producing bacterial cultures.
(A–F) Immunogold staining of ultrathin frozen sections of overnight LB agar cultures of strains TA50 (A–C) and 8033 (D–F) using anti-E. coli LPS antibody (recognizing all E. coli LPS types) (A) or anti-O103 LPS antibody (D), anti-EHEC-Hly antibody (B, E), or anti-EHEC-Hly antibody and either anti-E. coli LPS antibody (C) or anti-O103 LPS antibody (F); primary antibodies were detected using Protein A Gold with gold particles of 15 nm (anti-LPS antibodies) or 10 nm diameter (anti-EHEC-Hly antibody). (G, H) Ultrathin frozen sections of TA50 (G) and 8033 (H) overnight LB agar cultures stained with Protein A Gold alone, without anti-LPS (G) or anti-EHEC-Hly (H) antibody. (I) Ultrathin frozen section of overnight LB agar culture of EHEC-Hly-negative strain TA51 stained with anti-EHEC-Hly antibody and Protein A Gold with gold particles of 10 nm. Samples were analyzed using a FEI-Tecnai 12 electron microscope. Examples of bacterial cells (b) and OMVs (v) are indicated. Black frames delineate OMVs that were located at longer distances from the OMV-producing bacteria and, therefore, were detected in different microscopic fields. Arrows indicate bacterial outer membrane (OM), periplasmic space (P), and plasma (inner) membrane (PM). Empty arrow heads depict a membrane bilayer surrounding OMVs and black arrow heads depict EHEC-Hly located on OMV surface. Scale bars are 300 nm. Note that using electron microscopy of immunostained ultrathin cryo-sections only 10% - 15% of the total antigen present in the section can be detected explaining relatively low numbers of LPS and EHEC-Hly signals observed.
Figure 3
Figure 3. EHEC-Hly-containing and EHEC-Hly-free OMVs bind to and are internalized by HBMEC and Caco-2 cells.
(A) HBMEC and (B) Caco-2 cells were incubated with DiO-labeled OMVs from strains TA50, TA51, 8033 or 8033c for the times indicated and fluorescence was measured using a flow cytometer before (total cell-associated OMVs) and after (internalized OMVs) trypan blue quenching. Data are expressed as geometric means of fluorescence intensities from 10,000 cells after subtraction of background fluorescence of cells without OMVs, and are presented as means ± standard deviations from three independent experiments; * significant difference between cell-bound and internalized OMVs after 4 h (p<0.05). In addition, cells incubated with OMVs were analyzed using CLSM. OMVs (green) were detected using rabbit anti-E. coli LPS antibody and Alexa Fluor 488-conjugated goat anti-rabbit IgG, actin (red) was counterstained with phalloidin-TRITC and nuclei (blue) with DRAQ5. (C) HBMEC and Caco-2 cells were incubated for 4 h with OMV buffer (20 mM TRIS-HCl, pH 8.0) instead of OMVs and analyzed using CLSM as described above. Pictures were taken using a laser-scanning microscope (LSM 510 META microscope, equipped with a Plan-Apochromat 63x/1.4 oil immersion objective). All three fluorescence images were merged and confocal Z-stack projections are included in all images in panels A and B. The cross hairs show the position of the xy and yz planes. Scale bars are 10 µm.
Figure 4
Figure 4. EHEC-Hly-containing OMVs are internalized via dynamin-dependent endocytosis.
(A) OMVs from strains TA50, 8033, TA51 or 8033c labeled with rhodamine isothiocyanate B-R18 were incubated for 4 h with HBMEC and Caco-2 cells that had been pretreated (1 h) with inhibitors of endocytosis including dynasore (80 µM), chlorpromazine (15 µg/ml), or filipin III (10 µg/ml) or remained inhibitor-untreated (control). Fluorescence was measured using a plate reader and OMV uptake (reflected by fluorescence intensity) in the presence of each inhibitor was expressed as the percentage of OMV uptake by control, inhibitor-untreated cells. * significantly decreased (p<0.05) compared to control cells (unpaired Student's t test). Data are presented as means ± standard deviations from three independent experiments. (B, C). HBMEC and Caco-2 cells were incubated with TA50, TA51, 8033 or 8033c OMVs or with TF-488 or CTB-488 (positive controls) or with 20 mM TRIS-HCl buffer (no OMV) for 10 min and analyzed by CLSM. OMVs were stained with rabbit anti-E. coli LPS antibody and Alexa Fluor 488-conjugated goat anti-rabbit IgG (green), and clathrin (B) or caveolin (C) were stained using the respective mouse monoclonal antibody and Cy3-conjugated goat anti-mouse IgG (red). Nuclei were stained with DRAQ5 (blue). Pictures were taken using a laser-scanning microscope (LSM 510 META microscope equipped with a Plan-Apochromat 63x/1.4 oil immersion objective). All three fluorescence images were merged and consisted of one optical section of a z-series with a pinhole of 1 airy unit. Colocalized red and green signals appear in yellow (examples depicted by arrows). Scale bars are 10 µm. The percentages of colocalizations between OMVs and clathrin or caveolin (and TF-488/CTB-488 and clathrin/caveolin) were calculated using BioImageXD6 colocalization tool and are indicated by white numbers (averages from at least five different samples) in the images and depicted graphically in panel (D).
Figure 5
Figure 5. EHEC-Hly separates from OMVs during intracellular trafficking.
(A) HBMEC and Caco-2 cells were incubated with TA50 or 8033 OMVs for the times indicated and analyzed using CLSM. OMVs were stained using mouse anti-E. coli LPS antibody and Alexa Fluor 488-conjugated goat anti-mouse IgG (green), and EHEC-Hly (EHly) was stained using rabbit anti-EHEC-Hly antibody and Cy3-conjugated goat anti-rabbit IgG (red). Nuclei were stained with DRAQ5 (blue). Pictures were taken and processed as described in the legend to Figure 4. Colocalized red and green signals appear in yellow (examples are indicated by white arrows). Red arrows indicate examples of red signal of EHEC-Hly dissociating from OMVs during time. The percentages of colocalization between OMVs and EHEC-Hly were calculated using BioImageXD6 colocalization tool and are indicated by white numbers (averages from at least five different samples). (B) HBMEC and Caco-2 cells were incubated for 24 h with EHEC-Hly-free OMVs from strains TA51 or 8033c and stained as described in panel A. (C) HBMEC and Caco-2 cells were incubated for 24 h with 20 mM TRIS-HCl (OMV buffer) instead of OMVs and stained for OMVs and EHEC-Hly as described in panel A or stained with secondary antibodies in the absence of primary antibodies. Scale bars in all panels are 10 µm.
Figure 6
Figure 6. EHEC-Hly colocalizes with mitochondria.
HBMEC and Caco-2 cells were incubated with EHEC-Hly-containing OMVs from strains TA50 and 8033 or with EHEC-Hly-free OMVs from strains TA51 and 8033c (controls) or with 20 mM TRIS-HCl buffer in lieu of OMVs for 24 h. EHEC-Hly (EHly) was stained with anti-EHEC-Hly antibody and Alexa Fluor 488-conjugated goat anti-rabbit IgG (green) and mitochondria (Mito) were stained with MitoTracker Orange CMTMRos (red). DNA was stained with DRAQ5 (blue). Pictures were taken using a laser-scanning microscope (LSM 510 META microscope, equipped with a Plan-Apochromat 63x/1.4 oil immersion objective). All three fluorescence images were merged (left panels; colocalized red and green signals appear in yellow and examples are depicted by arrows) and single fluorescence channels are shown in the right panels. Pictures consisted of one optical section of a z-series with a pinhole of 1 airy unit. Scale bars are 10 µm. Note that mitotracker signals in cells treated with EHEC-Hly-containing OMVs (TA50, 8033) are slightly diffuse compared to those in cells treated with EHEC-Hly-free OMVs (TA51, 8033c) and in OMV-untreated cells, likely because of reduction of the mitochondrial transmembrane potential induced by EHEC-Hly at this time (see Figure 11E, 11F).
Figure 7
Figure 7. Colocalization of OMVs and EHEC-Hly with endo-lysosomal compartments detected with anti-CD63 antibody.
(A, B) HBMEC and Caco-2 cells were incubated with EHEC-Hly-containing (TA50 or 8033) or EHEC-Hly-free (TA51 or 8033c) OMVs for 8 h (A) and 24 h (B). OMVs were stained with rabbit anti-E. coli LPS antibody and Alexa Fluor 488-conjugated goat anti-rabbit IgG (green), lysosomes with mouse anti-CD63 antibody and Cy3-conjugated goat anti-mouse IgG (red), and nuclei with DRAQ5 (blue). (C, D) HBMEC and Caco-2 cells were incubated with EHEC-Hly-containing (TA50 or 8033) (C) or EHEC-Hly-free (TA51 or 8033c) OMVs (D) for 8 h and 24 h and stained as described above except that in lieu of OMVs, EHEC-Hly (EHly) was detected with rabbit anti-EHEC-Hly antibody and Alexa Fluor 488-conjugated goat anti-rabbit IgG (green). Pictures were taken and processed as described in the legend to Figure 4. Colocalized red and green signals appear in yellow (examples indicated by arrows). White numbers indicate the percentages of OMVs (A, B) and EHEC-Hly (C) colocalized with CD63-positive compartments (averages from at least five different samples) calculated using the BioImageXD6 colocalization tool. Scale bars are 10 µm. The images in panel D (8 h of incubation) are also representative of 24 h (no EHEC-Hly was detected in cells treated with EHEC-Hly-free OMVs at any of these time points).
Figure 8
Figure 8. Detection of OMVs and EHEC-Hly in lysosomal and mitochondrial fractions of cells treated with EHEC-Hly-containing OMVs.
(A-H) Lysosomes (Lyso) and mitochondria (Mito) were isolated from HBMEC and Caco-2 cells, which had been incubated with OMVs TA50 or 8033 for 8 h, 16 h and 24 h as described in Materials and Methods. The lysosomal and mitochondrial fractions were analyzed using Western blot for marker proteins of each respective fraction including LAMP-1 (A, B) and porin-2 (C, D), and for OMVs (anti-OmpA antibody) (E, F) and EHEC-Hly (G, H). Signals elicited from the lysosomal and mitochondrial fractions at each time are shown in the first part of each immunoblot, whereas the second part (separated by a line) includes controls run at the same gel (isolated OMVs TA50 and 8033 and cell lysates). The sizes of immunoreactive bands are indicated along the right sides of the blots. (I–L) Densitometric quantification of OmpA (I, J) and EHEC-Hly (K, L) signals shown in E, F and G, H, respectively, using Quantity One software; * significantly decreased (p<0.05) compared to 8 h; ** significantly increased (p<0.05) compared to 16 h (unpaired Student's t test). (M) Immunoblots of isolated lysosomal and mitochondrial fractions from control, OMV non-treated HBMEC and Caco-2 cells with the antibodies indicated.
Figure 9
Figure 9. Bafilomycin A1 inhibits translocation of EHEC-Hly from lysosomes to mitochondria.
(A) HBMEC and Caco-2 cells either pretreated with bafilomycin A1 (BafA1+) (100 nM, 1 h) or BafA1-untreated (BafA1-) were incubated with TA50 or 8033 OMVs or without OMVs for 24 h. Lysosomal and mitochondrial fractions were isolated and analyzed for OMVs and EHEC-Hly using immunoblot with anti-OmpA and anti-EHEC-Hly antibody, respectively. Efficiency of BafA1 treatment was verified using immunoblot with anti-LC3B antibody which detects an increased amount of processed LC3B-II in the presence of BafA1. The sizes of immunoreactive bands are indicated along the right side of Caco-2 cell blots. (B) BafA1-pretreated HBMEC and Caco-2 cells were incubated with TA50 or 8033 OMVs (or with control EHEC-Hly-free TA51 or 8033c OMVs) for 24 h and analysed using CLSM. Lysosomes were stained with anti-CD63 antibody and Cy3-conjugated goat anti-mouse IgG (red), EHEC-Hly (EHly) with anti-EHEC-Hly antibody and Alexa Fluor 488-conjugated IgG (green), and nuclei with DRAQ5 (blue). Pictures were taken and processed as described in the legend to Figure 4. Colocalized red and green signals appear in yellow (examples indicated by arrows). The percentages of colocalizations of EHEC-Hly with CD63-positive compartments were calculated using the BioImageXD6 colocalization tool and are shown (averages from at least five different samples) by white numbers in images in panel B and graphically in panel (C). Scale bars are 10 µM. (D) TA50 and 8033 OMVs were treated (1 h, 37°C) with TRIS-HCl buffer with pH ranging from 8.0 to 2.0; samples were ultracentrifuged and the pellets (P) (containing OMV-associated EHEC-Hly) and supernatants (S) (containing EHEC-Hly that had separated from OMVs) were analyzed for EHEC-Hly using immunoblotting. EHEC-Hly signals in P and S fractions were quantified densitometrically and the percentage of EHEC-Hly present in the P and S fraction at each particular pH was calculated from the total EHEC-Hly signal.
Figure 10
Figure 10. Releasing of EHEC-Hly from lysosomes leads to a transient loss of lysosomal function.
(A, B) HBMEC and Caco-2 cells were incubated with EHEC-Hly-containing (TA50 or 8033) or EHEC-Hly-free (TA51 or 8033c) OMVs for 8 h (A) and 24 h (B). OMVs were stained with rabbit anti-E. coli LPS antibody and Alexa Fluor 488-conjugated goat anti-rabbit IgG (green), lysosomes with Lysotracker Red DND-99 (red) and nuclei with DRAQ5 (blue). (C, D) HBMEC and Caco-2 cells were incubated with TA50 or 8033 OMVs (C) or with TA51 or 8033c OMVs (D) for 8 h and 24 h. EHEC-Hly (EHly) was stained with rabbit anti-EHEC-Hly antibody and Alexa Fluor 488-conjugated goat anti-rabbit IgG (green), lysosomes with Lysotracker Red DND-99 (red), and nuclei with DRAQ5 (blue). Pictures were taken and processed as described in the legend to Figure 4. Colocalized red and green signals appear in yellow (examples in panels A and B are depicted by arrows). White numbers indicate the percentages of OMVs or EHEC-Hly colocalized with Lysotracker Red DND-99-positive lysosomes (averages from at least five different samples) calculated using the BioImageXD6 colocalization tool. Scale bars are 10 µm. The pictures shown in panel D (8 h of incubation) are also representative of 24 h (no EHEC-Hly was detected in cells treated with EHEC-Hly-free OMVs at any of these time points).
Figure 11
Figure 11. Translocation of EHEC-Hly to mitochondria results in cytosolic cytochrome c release and ΔΨm decrease.
(A, B) HBMEC (A) and Caco-2 cells (B) were incubated for the times indicated with EHEC-Hly-containing OMVs TA50 or 8033 (20 µg of OMV protein containing 100 ng of EHEC-Hly) or with corresponding protein amounts of EHEC-Hly-negative OMVs TA51 or 8033c or left untreated (control). Mitochondrial and cytosolic fractions were isolated and immunoblotted with anti-cytochrome c antibody. After stripping, membranes were reprobed with antibody against porin-2 (mitochondrial marker) or actin (cytosolic marker). The sizes of immunoreactive bands are indicated. (C, D) Intensities of the cytochrome c signals in mitochondrial (mito) and cytosolic (cyto) fractions shown in panels A and B were quantified in HBMEC (C) and Caco-2 cells (D) using densitometry, expressed in arbitrary densitometric units (DU) and are presented as means ± standard deviations from three independent experiments. * Significantly decreased (p<0.05) compared to mitochondrial cytochrome c in control cells; ** significantly increased (p<0.05) compared to cytosolic cytochrome c in control cells (unpaired Student's t test). Mitochondrial cytochrome c signals in control cells (control mito) were almost identical after 8 h, 16 h and 24 h and are therefore shown as means ± standard deviations from all times. No cytochrome c was detected at any time in cytosol of control cells (control cyto). (E, F) HBMEC (E) and Caco-2 cells (F) were incubated with EHEC-Hly-containing or EHEC-Hly-free OMVs as indicated in A and B and ΔΨm was determined by uptake of TMRE using flow cytometry. Median fluorescence of OMV-treated cells was expressed as the percentage of the median fluorescence of control untreated cells (defined as 100%). The values represent means ± standard deviations from three independent experiments. * Significantly decreased (p<0.05) compared to control cells (unpaired Student's t test). Valinomycin (100 nM, 15 min) was a positive control.
Figure 12
Figure 12. EHEC-Hly induces activation of caspase-9 and caspase-3 and PARP cleavage.
(A, B) HBMEC (A) and Caco-2 cells (B) were incubated with different doses of TA50 or 8033 OMVs (20 µg or 10 µg of OMV protein containing 100 ng or 50 ng of EHEC-Hly, respectively) or with 20 µg of EHEC-Hly-negative OMVs (TA51 or 8033c) for the times indicated or remained untreated. Cells were lysed, the lysates were incubated with colorimetric substrates of caspase-9 (Ac-LEHD-pNA) or caspase-3 (Ac-DEVD-pNA) and the color intensity, which is proportional to the level of caspase enzymatic activity, was measured spectrophotometrically. The activity of each caspase in OMV-treated cells was expressed as a fold-increase of that in untreated cells (defined as 1). Specific inhibitors of caspase-9 (z-LEHD-fmk), caspase-3 (z-DEVD-fmk) or pan-caspase inhibitor z-VAD-fmk were added to cells 30 min before treatment with OMVs containing 100 ng of EHEC-Hly. Data are shown as means ± standard deviations from three independent experiments. * Significantly increased (p<0.05) compared to control cells (unpaired Student's t test). (C, D) HBMEC (C) and Caco-2 cells (D) were incubated with TA50 or 8033 OMVs (100 ng of EHEC-Hly) or with TA51 or 8033c OMVs (20 µg of OMV protein) for 48 h or remained untreated (negative control). Cells treated with 1 µM staurosporin (Stauro) for 3 h served as a positive control. Presence of uncleaved PARP (116 kDa) and the PARP cleavage product (89 kDa) in cell lysates was determined using an immunoblot with anti-PARP antibody; anti-actin antibody was used as a loading control. The results are representative of two independent experiments.
Figure 13
Figure 13. EHEC-Hly-containing OMVs cause DNA laddering and formation of TUNEL-positive nuclei.
(A, B) HBMEC (A) and Caco-2 cells (B) were incubated with EHEC-Hly-containing OMVs (TA50 or 8033; 100 ng of EHEC-Hly) or EHEC-Hly-free OMVs (TA51 or 8033c; 20 µg of OMV protein) for 48 h. Cellular DNA was separated on agarose gel and visualized after staining with Midori Green Advance. M, molecular size marker (100 bp DNA ladder). Untreated cells (Ctrl) were a negative control and cells treated with 1 µM staurosporin (Stauro) a positive control. (C, D) HBMEC (C) and Caco-2 cell (D) were incubated for the times indicated with TA50, 8033, TA51 or 8033c OMVs in the amounts shown above or with 1 µM staurosporin or remained untreated (control). After TUNEL reagent staining, the proportions of TUNEL-positive nuclei were determined by fluorescence microscopy and expressed as the percentage of total number of cells examined. Data are means ± standard deviations from three independent experiments. * Significantly increased (p<0.05) compared to control cells (unpaired Student's t test). (E, F) HBMEC (E) and Caco-2 cells (F), either without or after pretreatment with pan-caspase inhibitior z-VAD-fmk were incubated for 48 h with TA50 or 8033 OMVs or with 1 µM staurosporin and the percentages of TUNEL-positive nuclei were determined as described above. Data are means ± standard deviations from three independent experiments. * Significantly decreased (p<0.05) compared to non-pretreated cells (unpaired Student's t test). (G, H). Photomicrographs of TUNEL reagent-stained HBMEC (G) and Caco-2 cells (H) incubated for 48 h with the probes indicated or remained untreated (control). TUNEL-positive nuclei stain green, other nuclei blue (DAPI) and actin red (phalloidin-TRITC). Bars are 10 µm.
Figure 14
Figure 14. Model of intracellular trafficking and action of OMV-associated EHEC-Hly.
1. After its secretion by EHEC bacteria and association with OMVs, the OMV-associated EHEC-Hly is endocytosed by dynamin-dependent endocytosis and enters the endosomal compartments of target cells. 2. During endosome acidification via the H+-ATPase the neutral pH 7.4 of endosomes drops to pH 5.0, which induces separation of EHEC-Hly from OMVs. 3. The separated toxin plausibly interacts with the endosomal/lysosomal membrane and, as a pore-forming toxin, it damages lysosomal membrane by its pore-forming activity in order to release from lysosomes. As a consequence of the membrane damage, the proton gradient of lysosomes is disrupted leading to lysosomal pH increase. 4. EHEC-Hly released from lysosomes translocates by an unknown mechanism to mitochondria. 5. This results in cytochrome c release to the cytosol, which leads to activation of caspase-9 and caspase-3 and apoptotic cell death. 6. Presence of the proton ATPase inhibitor BafA1 inhibits endosomal acidification and thus prevents the toxin to be separated from OMVs. As a consequence, EHEC-Hly is trapped in endosomes/lysosomes and cannot translocate into mitochondria. The figure was produced using Servier Medical Art.

Similar articles

Cited by

References

    1. Tarr PI, Gordon CA, Chandler WL (2005) Shiga-toxin-producing Escherichia coli and haemolytic uraemic syndrome. Lancet 365: 1073–1086. - PubMed
    1. Zoja C, Buelli S, Morigi M (2010) Shiga toxin-associated hemolytic uremic syndrome: pathophysiology of endothelial dysfunction. Pediatr Nephrol 25: 2231–2240. - PubMed
    1. Bielaszewska M, Sinha B, Kuczius T, Karch H (2005) Cytolethal distending toxin from Shiga toxin-producing Escherichia coli O157 causes irreversible G2/M arrest, inhibition of proliferation, and death of human endothelial cells. Infect Immun 73: 552–562. - PMC - PubMed
    1. Paton AW, Srimanote P, Talbot UM, Wang H, Paton JC (2004) A new family of potent AB5 cytotoxins produced by Shiga toxigenic Escherichia coli . J Exp Med 200: 35–46. - PMC - PubMed
    1. Bielaszewska M, Bauwens A, Greune L, Kemper B, Dobrindt U, et al. (2009) Vacuolisation of human microvascular endothelial cells by enterohaemorrhagic Escherichia coli . Thromb Haemost 102: 1080–1092. - PubMed

Publication types

MeSH terms

Associated data