

Semen CD4+ T cells and macrophages are productively infected at all stages of SIV infection in macaques
- PMID: 24348253
- PMCID: PMC3861532
- DOI: 10.1371/journal.ppat.1003810
Semen CD4+ T cells and macrophages are productively infected at all stages of SIV infection in macaques
Abstract
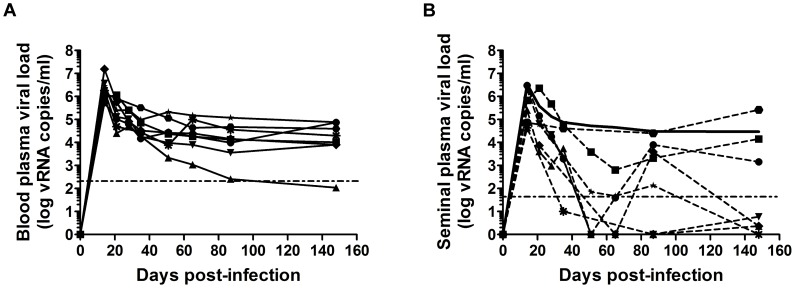
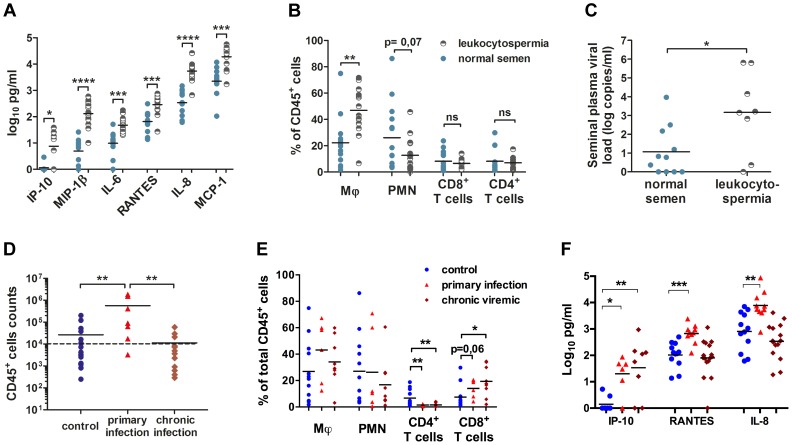
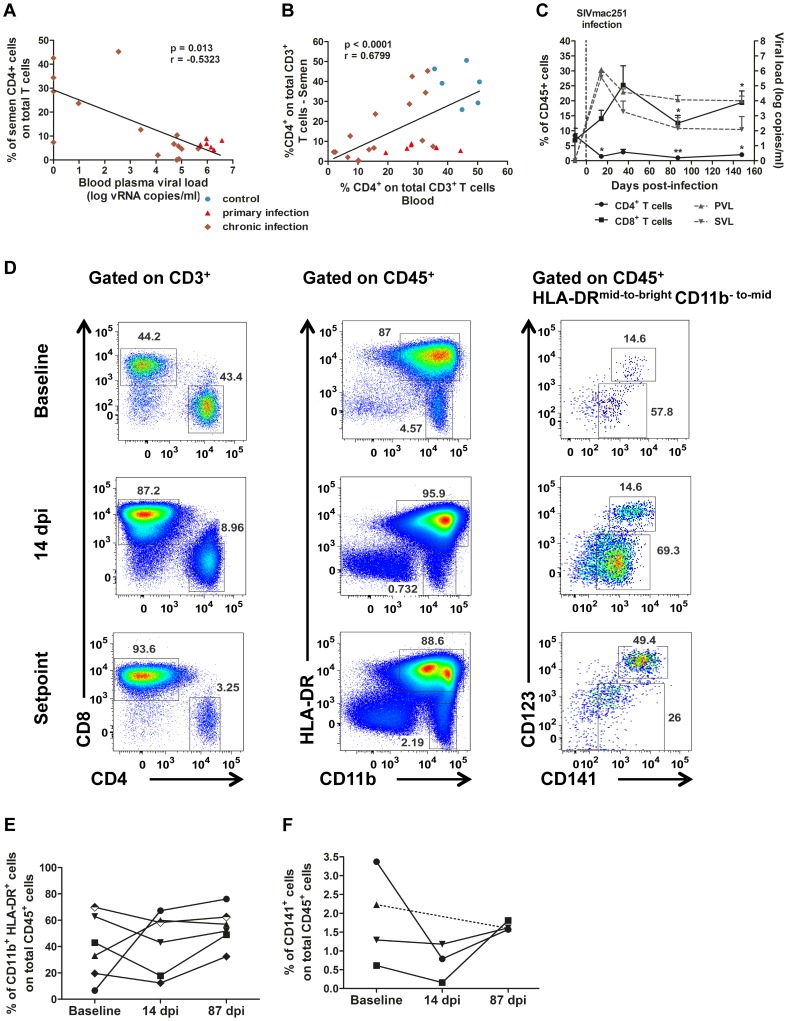
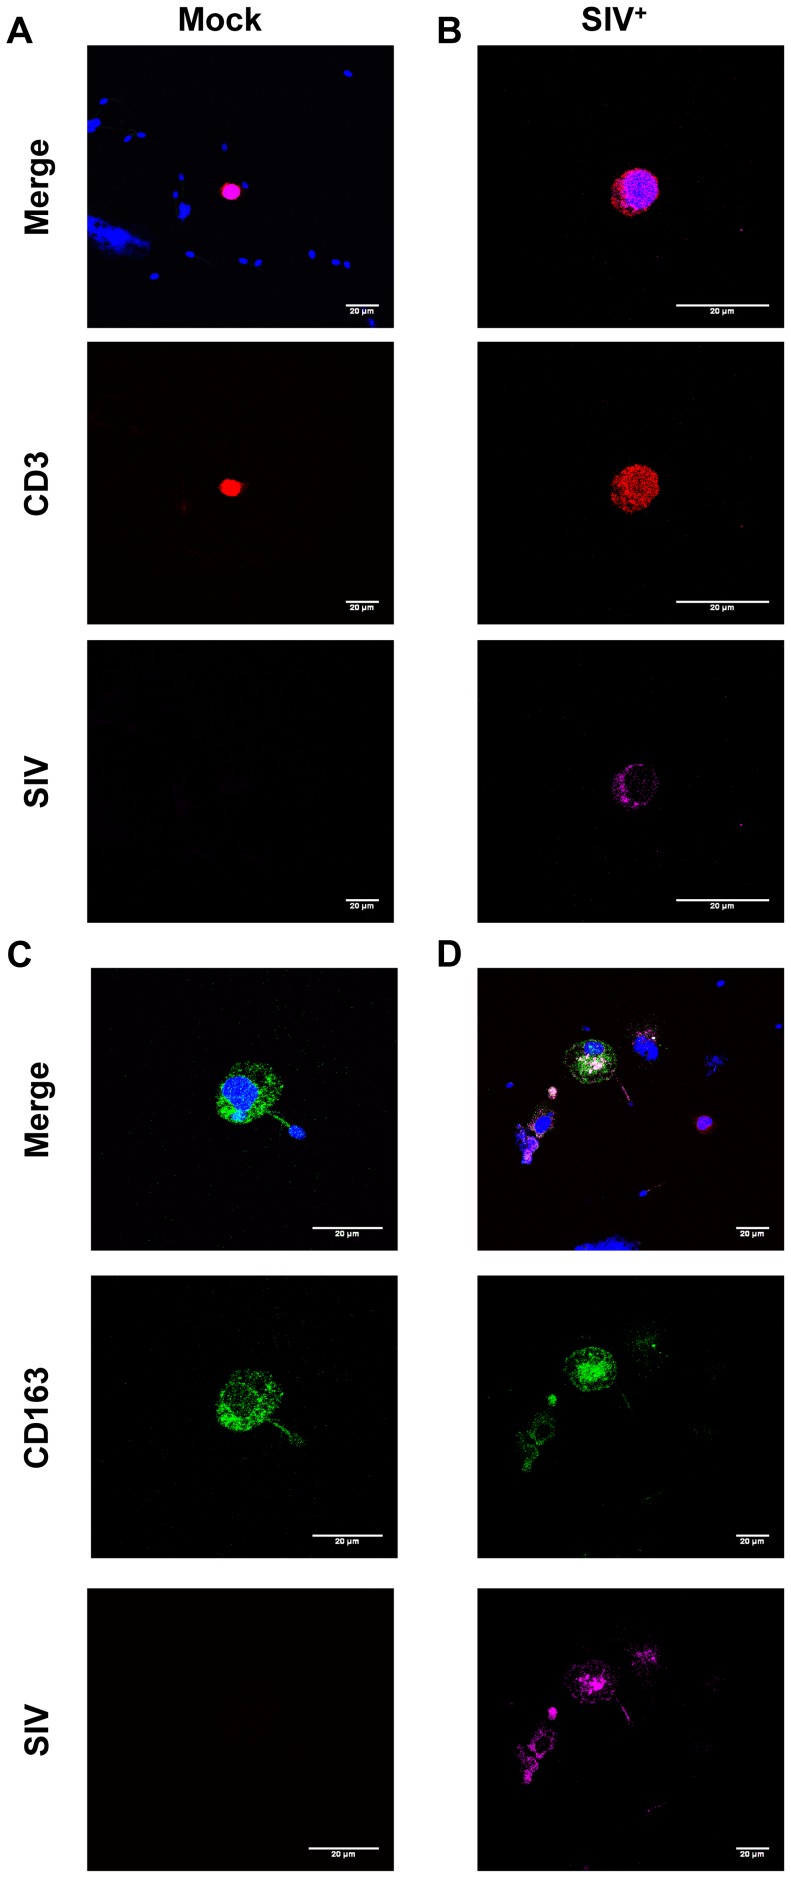
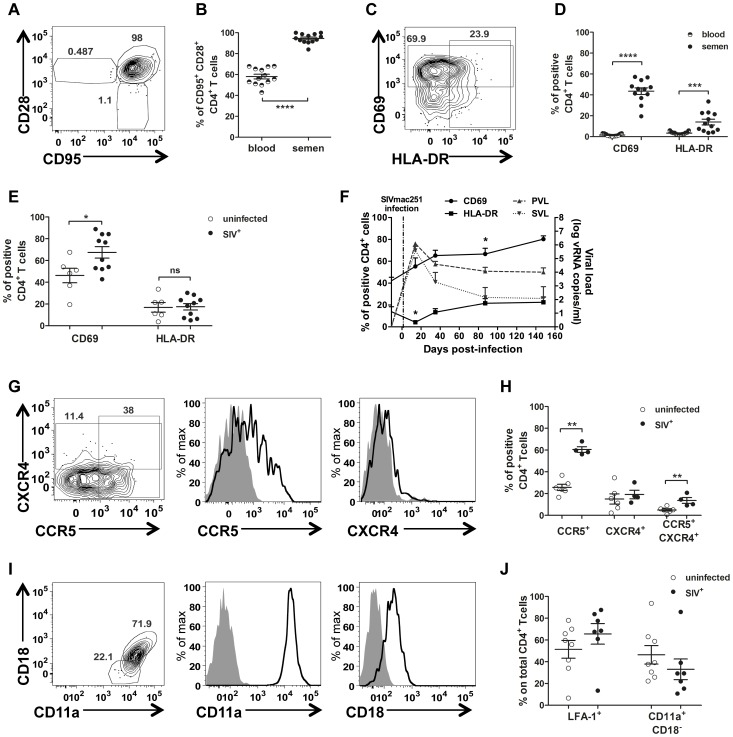
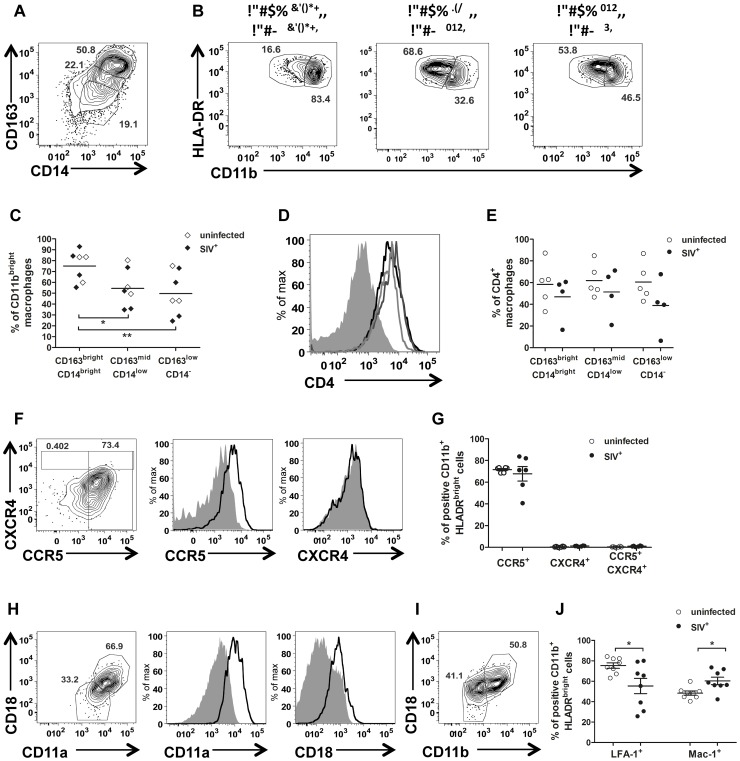
The mucosal events of HIV transmission have been extensively studied, but the role of infected cells present in the genital and rectal secretions, and in the semen, in particular, remains a matter of debate. As a prerequisite to a thorough in vivo investigation of the early transmission events through infected cells, we characterized in detail by multi-parameter flow cytometry the changes in macaque seminal leukocytes during SIVmac251 infection, focusing on T cells, macrophages and dendritic cells. Using immunocytofluorescence targeting SIV proteins and real-time quantitative PCR targeting SIV DNA, we investigated the nature of the infected cells on sorted semen leukocytes from macaques at different stages of infection. Finally, we cocultured semen CD4(+) T cells and macrophages with a cell line permissive to SIV infection to assess their infectivity in vitro. We found that primary infection induced strong local inflammation, which was associated with an increase in the number of leukocytes in semen, both factors having the potential to favor cell-associated virus transmission. Semen CD4(+) T cells and macrophages were productively infected at all stages of infection and were infectious in vitro. Lymphocytes had a mucosal phenotype and expressed activation (CD69 & HLA-DR) and migration (CCR5, CXCR4, LFA-1) markers. CD69 expression was increased in semen T cells by SIV infection, at all stages of infection. Macrophages predominated at all stages and expressed CD4, CCR5, MAC-1 and LFA-1. Altogether, we demonstrated that semen contains the two major SIV-target cells (CD4+ T cells and macrophages). Both cell types can be productively infected at all stages of SIV infection and are endowed with markers that may facilitate transmission of infection during sexual exposure.
Conflict of interest statement
The authors have declared that no competing interests exist.
Figures
Similar articles
-
Quantitation of Productively Infected Monocytes and Macrophages of Simian Immunodeficiency Virus-Infected Macaques.J Virol. 2016 May 27;90(12):5643-5656. doi: 10.1128/JVI.00290-16. Print 2016 Jun 15. J Virol. 2016. PMID: 27030272 Free PMC article.
-
Characterisation of simian immunodeficiency virus-infected cells in pigtail macaques.Virology. 2012 Jun 20;428(1):11-20. doi: 10.1016/j.virol.2012.03.016. Epub 2012 Apr 15. Virology. 2012. PMID: 22507218
-
Innate and Adaptive Anti-SIV Responses in Macaque Semen: Implications for Infectivity and Risk of Transmission.Front Immunol. 2020 May 12;11:850. doi: 10.3389/fimmu.2020.00850. eCollection 2020. Front Immunol. 2020. PMID: 32528466 Free PMC article.
-
Nonhuman primate models for cell-associated simian immunodeficiency virus transmission: the need to better understand the complexity of HIV mucosal transmission.J Infect Dis. 2014 Dec 15;210 Suppl 3:S660-6. doi: 10.1093/infdis/jiu536. J Infect Dis. 2014. PMID: 25414421 Review.
-
The SIV Envelope Glycoprotein, Viral Tropism, and Pathogenesis: Novel Insights from Nonhuman Primate Models of AIDS.Curr HIV Res. 2018;16(1):29-40. doi: 10.2174/1570162X15666171124123116. Curr HIV Res. 2018. PMID: 29173176 Review.
Cited by
-
Long-term control of simian immunodeficiency virus (SIV) in cynomolgus macaques not associated with efficient SIV-specific CD8+ T-cell responses.J Virol. 2015 Apr;89(7):3542-56. doi: 10.1128/JVI.03723-14. Epub 2015 Jan 14. J Virol. 2015. PMID: 25589645 Free PMC article.
-
Human Immunodeficiency Virus (HIV) Infection and Use of Illicit Substances Promote Secretion of Semen Exosomes that Enhance Monocyte Adhesion and Induce Actin Reorganization and Chemotactic Migration.Cells. 2019 Sep 3;8(9):1027. doi: 10.3390/cells8091027. Cells. 2019. PMID: 31484431 Free PMC article.
-
The importance of semen leukocytes in HIV-1 transmission and the development of prevention strategies.Hum Vaccin Immunother. 2020 Sep 1;16(9):2018-2032. doi: 10.1080/21645515.2020.1765622. Epub 2020 Jul 2. Hum Vaccin Immunother. 2020. PMID: 32614649 Free PMC article. Review.
-
Generation of HIV-Resistant Macrophages from IPSCs by Using Transcriptional Gene Silencing and Promoter-Targeted RNA.Mol Ther Nucleic Acids. 2018 Sep 7;12:793-804. doi: 10.1016/j.omtn.2018.07.017. Epub 2018 Aug 4. Mol Ther Nucleic Acids. 2018. PMID: 30141412 Free PMC article.
-
NK Cells in Protection from HIV Infection.Viruses. 2022 May 25;14(6):1143. doi: 10.3390/v14061143. Viruses. 2022. PMID: 35746615 Free PMC article. Review.
References
Publication types
MeSH terms
Substances
LinkOut - more resources
Full Text Sources
Other Literature Sources
Research Materials
