. 2013;9(12):e1003984.
doi: 10.1371/journal.pgen.1003984. Epub 2013 Dec 12.

Genetic recombination is targeted towards gene promoter regions in dogs

Affiliations

Genetic recombination is targeted towards gene promoter regions in dogs

Adam Auton et al. PLoS Genet. 2013.

Abstract

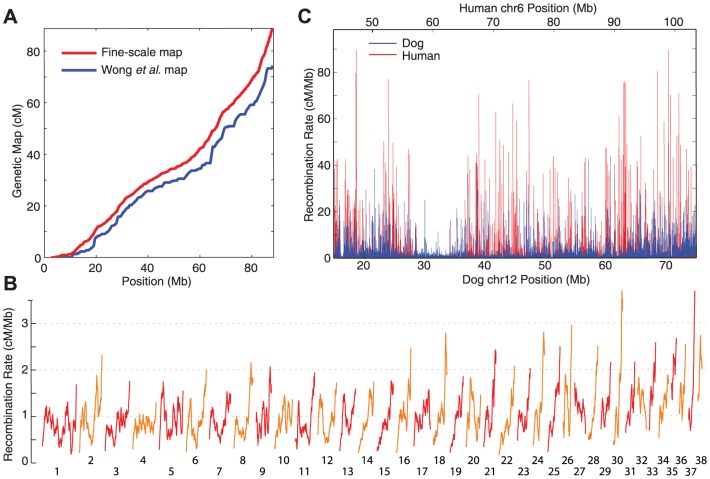
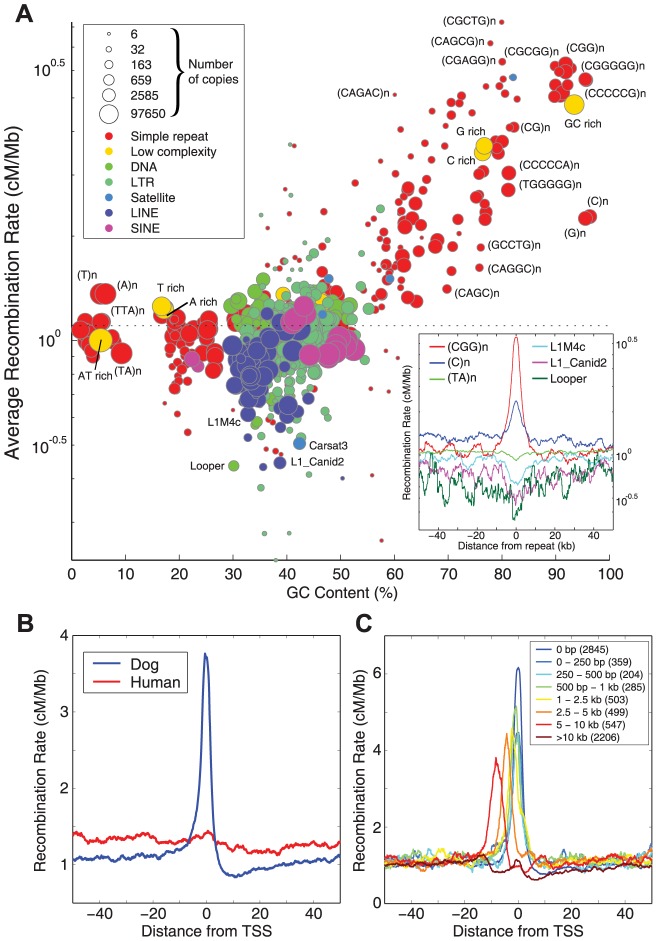
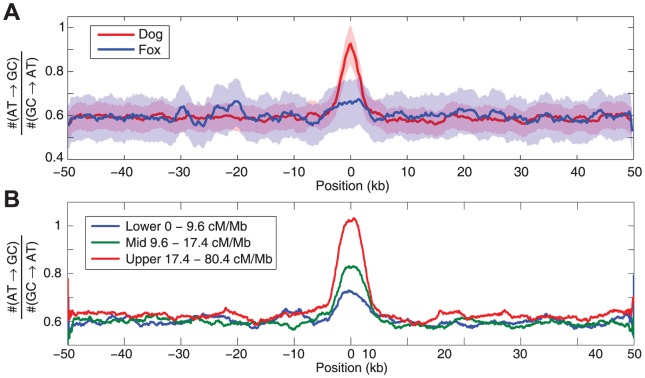
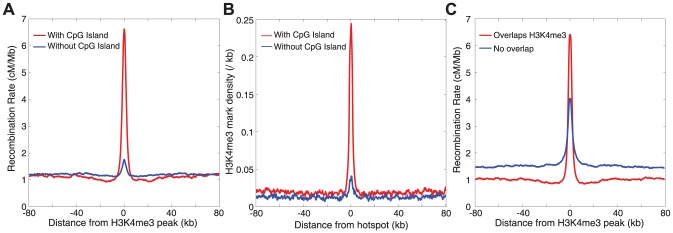
The identification of the H3K4 trimethylase, PRDM9, as the gene responsible for recombination hotspot localization has provided considerable insight into the mechanisms by which recombination is initiated in mammals. However, uniquely amongst mammals, canids appear to lack a functional version of PRDM9 and may therefore provide a model for understanding recombination that occurs in the absence of PRDM9, and thus how PRDM9 functions to shape the recombination landscape. We have constructed a fine-scale genetic map from patterns of linkage disequilibrium assessed using high-throughput sequence data from 51 free-ranging dogs, Canis lupus familiaris. While broad-scale properties of recombination appear similar to other mammalian species, our fine-scale estimates indicate that canine highly elevated recombination rates are observed in the vicinity of CpG rich regions including gene promoter regions, but show little association with H3K4 trimethylation marks identified in spermatocytes. By comparison to genomic data from the Andean fox, Lycalopex culpaeus, we show that biased gene conversion is a plausible mechanism by which the high CpG content of the dog genome could have occurred.


Conflict of interest statement

The authors have declared that no competing interests exist.

Figures

Figure 1
Figure 1. The distribution of recombination.
A) Genetic maps for chromosome 2 estimated using LD (red) and pedigrees (blue). Other chromosomes are shown in Figure S2. B) Genome-wide broad-scale recombination rates for each autosomal chromosome (red and orange). Rates were smoothed at the 5 Mb scale. C) Fine-scale recombination rates compared between dog (blue) and human (red) over a largely syntenic 60 Mb region .
Figure 2
Figure 2. Recombination around genome features.
A) Average recombination rates (on a logarithmic scale) for DNA repeats as a function of average GC content. Bubble size gives an indication of the number of repeats in a given family, with colors indicating higher-level repeat classes. Recombination rates for each repeat were estimated in a 5 kb window centered on the repeat, thinned so that no two repeats were within 10 kb. The insert shows (log scale) recombination rates around a selection of repeats. B) Recombination rates around TSS in dog (blue) shows an elevation that dwarfs the small elevation seen in human (red). C) Recombination rates around TSS partitioned on the basis of distance to the nearest CpG island (as defined by the UCSC genome browser), ranging from genes with a CpG island overlapping the TSS (dark blue) to genes with no CpG island within 10 kb (dark red).
Figure 3
Figure 3. Evidence of biased gene conversion in dog and fox genomes.
The plots show the ratio of the number of AT→GC polymorphisms relative to the number of GT→AT polymorphisms around hotspots detected in dog that were localized to within 5 kb. A) The (AT→GC)/(GC→AT) ratio around hotspots for SNPs discovered in dog (red) and fox (blue). 95% confidence intervals are shown as shaded areas, as assessed via bootstrap. B) The (AT→GC)/(GC→AT) ratio for polymorphisms originating along the dog lineage is stronger around more recombinogenic hotspots. The skew is shown around strong (red), intermediate (green), and weak (blue) hotspots, as defined by the peak rates described in the legend.
Figure 4
Figure 4. The relationship between recombination and H3K4 trimethylation.
A) Recombination rates around H3K4me3 peaks, partitioned into peaks that contain a CpG island (red), and peaks without a CpG island (blue). B) The density of H3K4me3 marks around recombination hotspots partitioned into those hotspots that overlap a CpG island (red), and those that do not (blue). C) Recombination rates around CpG islands overlapping a H3K4me3 peak (red), and those not overlapping a H3K4me3 peak (blue).

Similar articles

Cited by

References

    1. Myers S, Bowden R, Tumian A, Bontrop RE, Freeman C, et al. (2010) Drive against hotspot motifs in primates implicates the PRDM9 gene in meiotic recombination. Science 327: 876–879. - PMC - PubMed
    1. Baudat F, Buard J, Grey C, Fledel-Alon A, Ober C, et al. (2010) PRDM9 is a major determinant of meiotic recombination hotspots in humans and mice. Science 327: 836–840. - PMC - PubMed
    1. Parvanov ED, Petkov PM, Paigen K (2010) Prdm9 controls activation of mammalian recombination hotspots. Science 327: 835. - PMC - PubMed
    1. Smagulova F, Gregoretti IV, Brick K, Khil P, Camerini-Otero RD, et al. (2011) Genome-wide analysis reveals novel molecular features of mouse recombination hotspots. Nature 472: 375–378. - PMC - PubMed
    1. Buard J, Barthes P, Grey C, de Massy B (2009) Distinct histone modifications define initiation and repair of meiotic recombination in the mouse. EMBO J 28: 2616–2624. - PMC - PubMed

Publication types

Substances

LinkOut - more resources