. 2013;9(12):e1003989.
doi: 10.1371/journal.pgen.1003989. Epub 2013 Dec 12.

MAN1B1 deficiency: an unexpected CDG-II

Affiliations

MAN1B1 deficiency: an unexpected CDG-II

Daisy Rymen et al. PLoS Genet. 2013.

Abstract

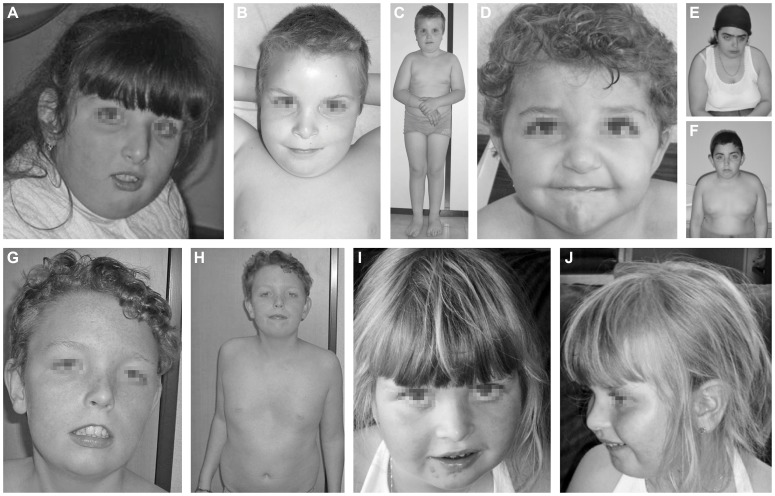
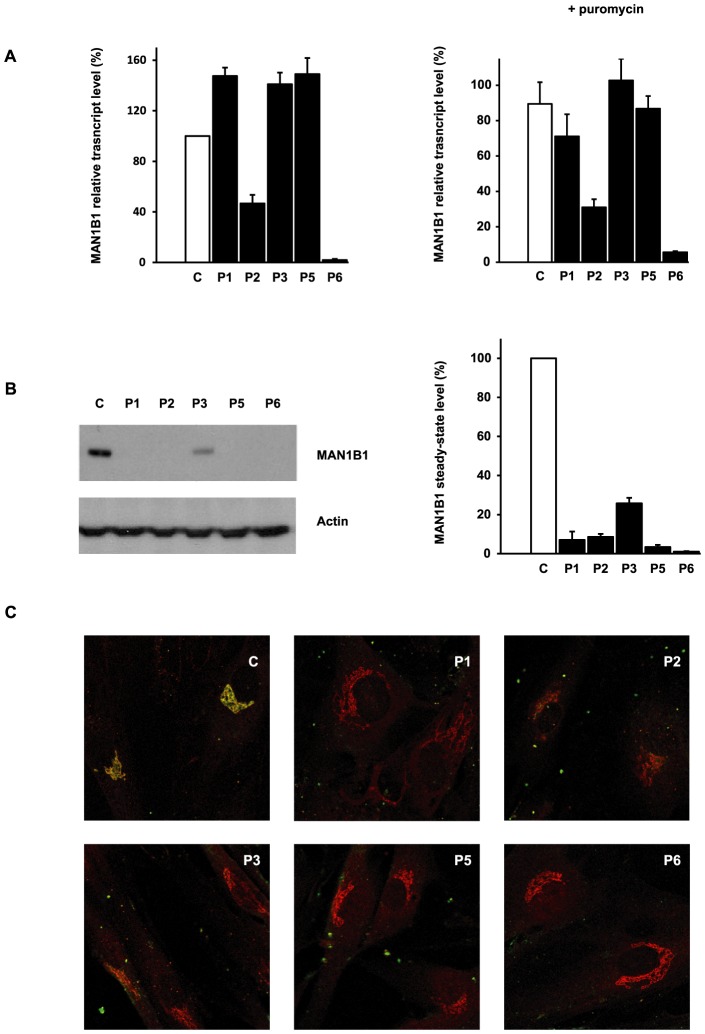
Congenital disorders of glycosylation (CDG) are a group of rare metabolic diseases, due to impaired protein and lipid glycosylation. In the present study, exome sequencing was used to identify MAN1B1 as the culprit gene in an unsolved CDG-II patient. Subsequently, 6 additional cases with MAN1B1-CDG were found. All individuals presented slight facial dysmorphism, psychomotor retardation and truncal obesity. Generally, MAN1B1 is believed to be an ER resident alpha-1,2-mannosidase acting as a key factor in glycoprotein quality control by targeting misfolded proteins for ER-associated degradation (ERAD). However, recent studies indicated a Golgi localization of the endogenous MAN1B1, suggesting a more complex role for MAN1B1 in quality control. We were able to confirm that MAN1B1 is indeed localized to the Golgi complex instead of the ER. Furthermore, we observed an altered Golgi morphology in all patients' cells, with marked dilatation and fragmentation. We hypothesize that part of the phenotype is associated to this Golgi disruption. In conclusion, we linked mutations in MAN1B1 to a Golgi glycosylation disorder. Additionally, our results support the recent findings on MAN1B1 localization. However, more work is needed to pinpoint the exact function of MAN1B1 in glycoprotein quality control, and to understand the pathophysiology of its deficiency.


Conflict of interest statement

The authors have declared that no competing interests exist.

Figures

Figure 1
Figure 1. Clinical features of the seven cases.
Clinical features of P1 at the age of 7 years (A), P2 at the age of 10 years (B, C), P3 at the age 3.5 years (D), P4.1 at the age of 18 years (E), P4.2 at the age of 12 years (F), P5 at the age of 13 years (G, H) and P6 at the age of 5 years (I, J). Note the facial dysmorphism, i.e. hypertelorism with downslanting palpebral fissures (A, D, E, F, G), large, low set ears (A, B, C, D, E, F, G, J), thin upper lip with hypoplastic nasolabial fold (A, B, D, E, F, G, I), tubular nose in P1, P4.1 and P4.2 (A, E, F) and a depressed nasal bridge in patients P2, P3, P5 and P6 (B, D, G, I). Note the truncular obesity (C, E, F, H) and the widely spaced, inverted nipples (B, F, H). Note the pectus excavatum in P5 (H).
Figure 2
Figure 2. IEF profiles of serum transferrin.
Isoelectrofocusing pattern of serum transferrin in MAN1B1-deficient individuals and a control. 2, 4 and 6 indicate disialo-, tetrasialo-, and hexasialotransferrin isoforms, respectively. The asterisk mark represents the trisialotransferrin isoform.
Figure 3
Figure 3. MAN1B1-deficient individuals are deficient in protein N-glycosylation.
MALDI-TOF spectra of the permethylated N-glycans from sera of control and MAN1B1-deficient individuals. Respective m/z values of N-glycans structures accumulating in MAN1B1-deficient cells are displayed in red. The symbols representing sugar residues are as follows: closed square, N-acetylglucosamine; closed circle: mannose; open circle, galactose; closed diamond, sialic acid; and closed triangle, fucose. Linkages between sugar residues have been removed for simplicity.
Figure 4
Figure 4. MAN1B1-deficient fibroblasts present alterations in Golgi structure.
Golgi localization of GM130 (red) and TGN46 (green) in control and MAN1B1-deficient fibroblasts. Cells were fixed, double-labelled with antibodies against GM130 and TGN46, and analysed by confocal laser scanning microscopy. Scale bar represents 10 µm.
Figure 5
Figure 5. Functional analyses of MAN1B1 mutations.
(A) Quantification of the MAN1B1 transcript in controls and affected individuals by qPCR without (left panel) and with (right panel) puromycin. MAN1B1 expression was normalized to the expression of the house-keeping gene HPRT. Values plotted with a wild-type control untreated with puromycin are set to 1. The depicted values are the mean ± SEM of at least three independent experiments. (B) Steady-state levels of the expression of MAN1B1 in control (C) and MAN1B1-deficient (P) fibroblasts. Whole-cell extracts were analysed by immunoblotting using anti-MAN1B1 antibodies. Thirty micrograms of total cell extracts were loaded into each lane and anti-β-actin antibodies were used as a loading control. Quantifications represent the mean value of three independent loadings of three independent samples. (C) Intracellular distribution of MAN1B1 in control and MAN1B1-deficient fibroblasts. Fibroblasts were double-labelled with antibodies against MAN1B1 (green) and the Golgi marker giantin (red), then fixed and processed for analysis by confocal laser scanning microscopy. Images were collected under identical settings. Depicted are the zoomed images. The independent panels are presented in Figure S4.
Figure 6
Figure 6. Subcellular localisation of MAN1B1.
(A) Indirect double immunofluorescence staining of control and MAN1B1-deficient fibroblasts. The cells were double-labelled with antibodies against MAN1B1 and with antibodies against either the Golgi markers GPP130 and giantin, the ER-Golgi intermediate compartment (ERGIC) marker ERGIC-53, or the ER marker PDI. The cells were then examined by confocal laser scanning microscopy. Images were collected under identical settings. Scale bar represents 10 µm. (B) Confocal linescan analysis of the distribution of MAN1B1. The pixel intensity (vertical axis) of MAN1B1 (green) and PDI, ERGIC-53, giantin and GPP130 (from top to bottom, red) was hence measured along a vector drawn perpendicular across the Golgi stack and plotted versus distance (horizontal axis), using the RGB profiler plugin from Image J.
Figure 7
Figure 7. HPLC analysis of N-linked oligosaccharides from control and patient's fibroblasts reveal a delay of trimming from Man9GlcNAc2 to Man8GlcNAc2 in MAN1B1-deficient patients.
Protein N-linked oligosaccharides of two different control (A) and one MAN1B1-deficient individuals (P2, B) were separated by HPLC after the pulse period (left panels) and 2 hours of chase (right panels). Depicted for both controls and P2 are two representative chromatograms from two independent experiments, with one set of experiments presented in the upper panel, and a second one in the lower panel. Symbols: M8, M9 indicate oligosaccharide species with 8 or 9 mannose residues and possessing two GlcNAc resides at their reducing ends. G1M9 indicates oligosaccharide species with 9 mannose and 1 Glc residues and possessing two GlcNAc residues at their reducing ends. (C) Relative peak areas of M8, M9, and G1M9 were quantified and the results expressed as the percentage of processing efficiency to M8. In the calculation, the trimming efficiency from M9 to M8, which corresponds to the difference between the percentage of M8 at T0 h and T2 h, was considered as 100%. The depicted values are the mean ± SEM of independent experiments. (D) Comparison of the mean processing efficacy of the three control cell lines (C) to the mean processing efficacy of all four MAN1B1-deficient cell lines (P). Data were analysed by using Student's t test. *** indicates a p value<0.001.

Similar articles

Cited by

References

    1. Jaeken J, Matthijs G (2007) Congenital disorders of glycosylation: a rapidly expanding disease family. Annual review of genomics and human genetics 8: 261–278 Available: http://www.ncbi.nlm.nih.gov/pubmed/17506657. Accessed 2 February 2013. - PubMed
    1. Theodore M, Morava E (2011) Congenital disorders of glycosylation: sweet news. Current opinion in pediatrics 23: 581–587 Available: http://www.ncbi.nlm.nih.gov/pubmed/21970833. Accessed 7 February 2013. - PubMed
    1. Matthijs G, Rymen D, Millón MBB, Souche E, Race V (2013) Approaches to homozygosity mapping and exome sequencing for the identification of novel types of CDG. Glycoconjugate journal 30: 67–76 Available: http://www.ncbi.nlm.nih.gov/pubmed/22983704. Accessed 7 February 2013. - PubMed
    1. Stevens FJ, Argon Y (1999) Protein folding in the ER. Seminars in cell & developmental biology 10: 443–454 Available: http://www.ncbi.nlm.nih.gov/pubmed/10597627. Accessed 7 February 2013. - PubMed
    1. Jakob CA, Burda P, Roth J, Aebi M (1998) Degradation of misfolded endoplasmic reticulum glycoproteins in Saccharomyces cerevisiae is determined by a specific oligosaccharide structure. The Journal of cell biology 142: 1223–1233 Available: http://www.pubmedcentral.nih.gov/articlerender.fcgi?artid=2149342&tool=p.... Accessed 7 February 2013. - PMC - PubMed

Publication types

MeSH terms

Substances