. 2013 Dec 3:7:177.
doi: 10.3389/fnbeh.2013.00177. eCollection 2013.

Oscillatory interaction between amygdala and hippocampus coordinates behavioral modulation based on reward expectation

Affiliations

Oscillatory interaction between amygdala and hippocampus coordinates behavioral modulation based on reward expectation

Satoshi Terada et al. Front Behav Neurosci. .

Abstract

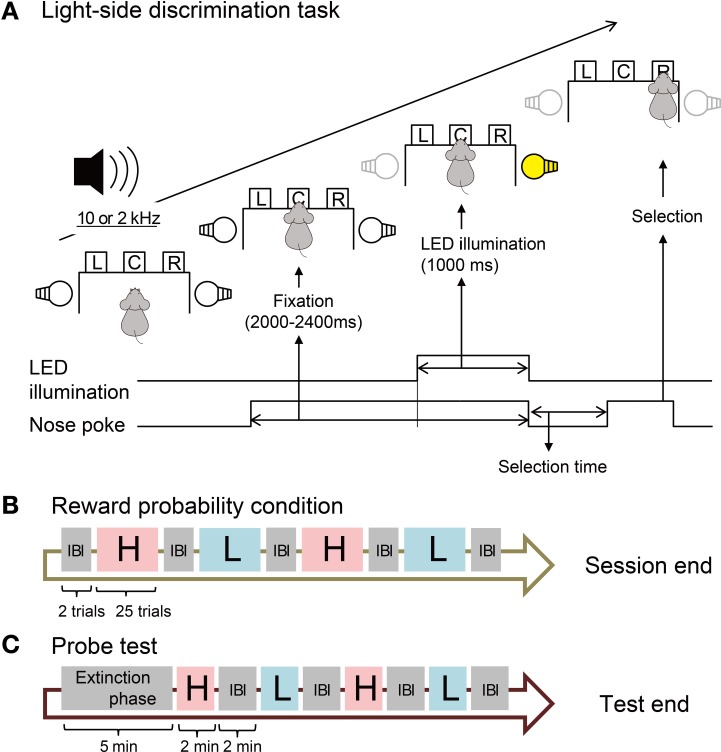
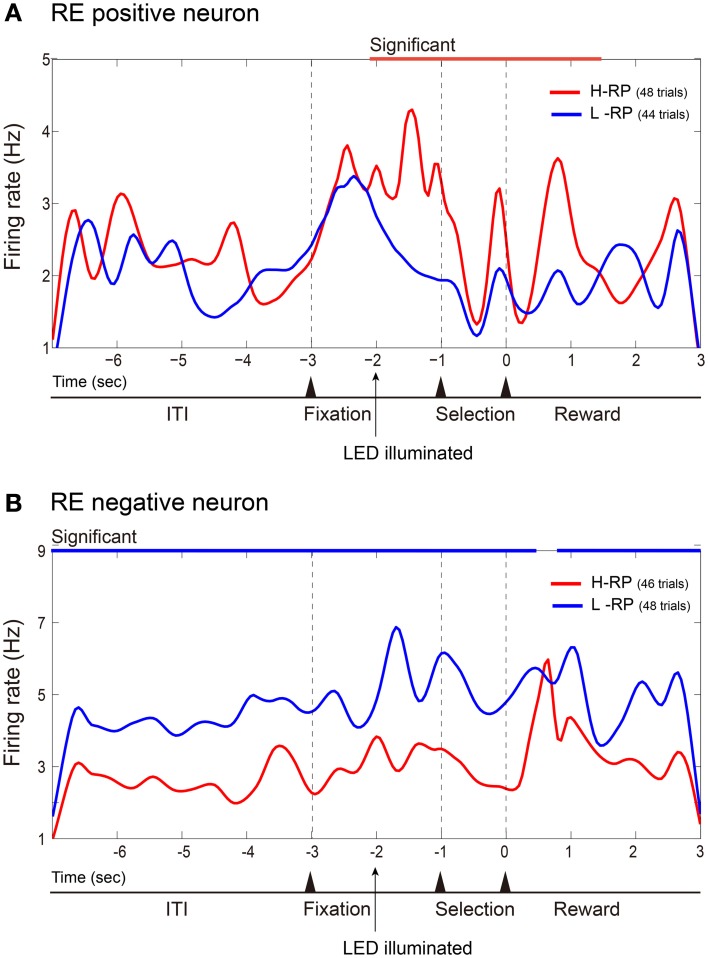
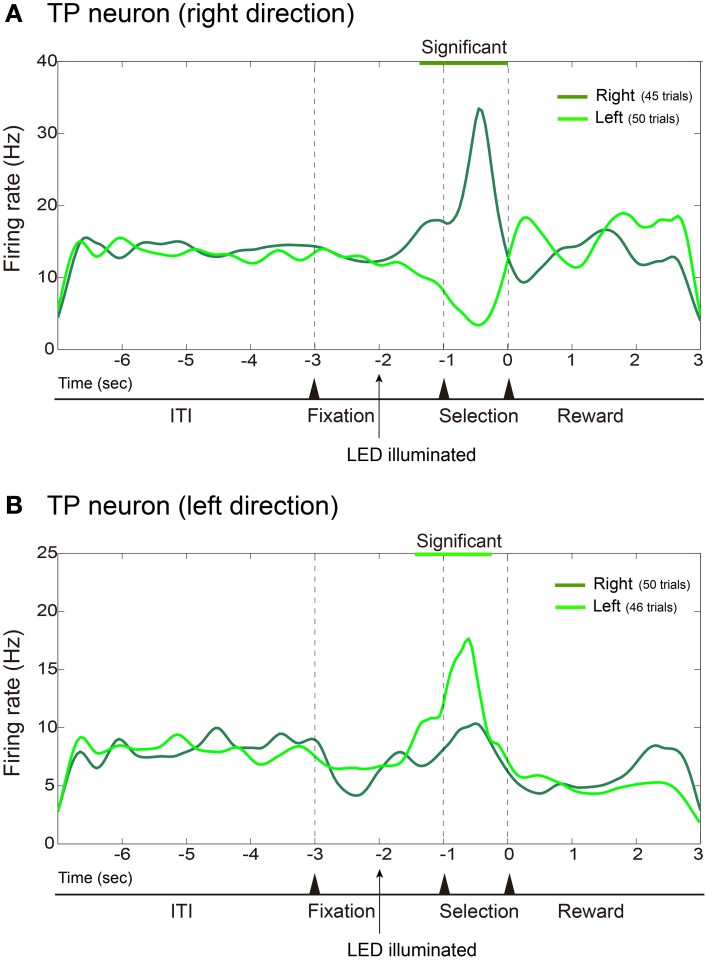
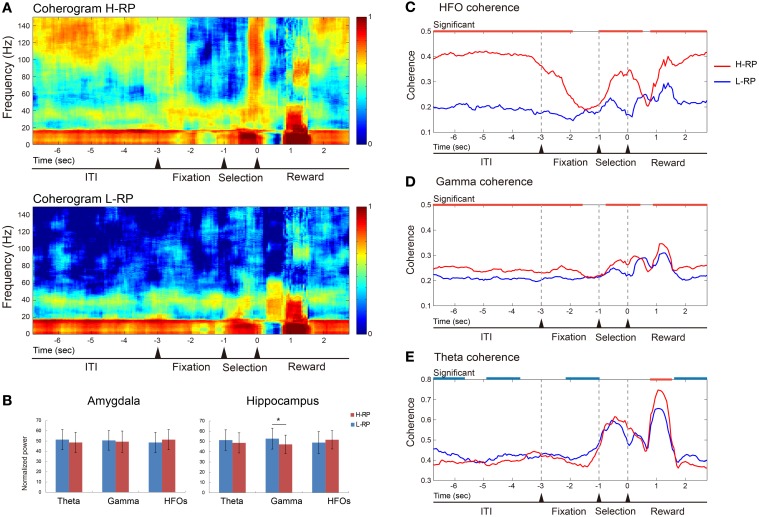
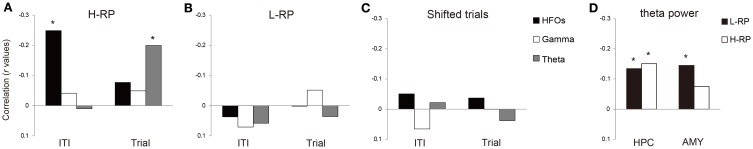
The aim of this study is to examine how the amygdala and hippocampus interact for behavioral performance modulated by different Reward-expectations (REs). We simultaneously recorded neuronal spikes and local field potential from the basolateral amygdala and hippocampal CA1 while rats were performing a light-side discrimination task with different expectations of a high or low probability of reward delivery. Here, we report the following results. First, the rats actually modulated their behavioral performance on their expectations of a high or low probability of reward. Second, we found more neurons related to RE in the amygdala and more neurons related to task performance in the hippocampus. Third, a prominent increase in the coherence of high-frequency oscillations (HFOs) (90-150 Hz) between the amygdala and the hippocampus was present during high RE. Fourth, coherent HFOs during inter-trial intervals and theta coherence during trials had significant correlations with the behavioral goal-selection time. Finally, cross-frequency couplings of LFPs within and across the amygdala and hippocampus occurred during ITI. These results suggest that the amygdala and hippocampus have different functional roles in the present task with different REs, and the distinctive band of coherence between the amygdala and the hippocampus contributes to behavioral modulation on the basis of REs. We propose that the amygdala influences firing rates and the strength of synchronization of hippocampal neurons through coherent oscillation, which is a part of the mechanism of how reward expectations modulate goal-directed behavior.

Keywords: amygdala; behavioral modulation; hippocampus; oscillation synchrony; reward expectation.


Figures

Figure 1
Figure 1
Design of behavioral task. (A) Procedure of the light-side discrimination task. One of two pure tones (2 and 10 kHz) is constantly presented during the trial. The operant chamber is equipped with left (L), center (C), and right (R) sensor holes for nose-poke behavior. The bottom lines and arrows show the time course of events in one trial. (B) Sequence of blocks with different reward probability conditions. In each block of 25 trials, the reward probability is fixed to high (H, 80%) or low (L, 20%). The rats are informed of the high or low probability of the reward by one of the two pure tones. No tone is presented in inter-block intervals (IBI). (C) Sequence of blocks in the probe test. One of the two pure tones is presented in each block but rats obtain no reward. No tone is presented during the extinction phase.
Figure 2
Figure 2
Behavioral performance in recording sessions. (A) Mean selection times under the H-RP and L-RP conditions in all sessions. Error bars show standard deviations. (B) Mean correct rates under the H-RP and L-RP conditions in all sessions. (C) Mean numbers of trials the rats performed in blocks and IBI in the probe test. Asterisks indicate significant differences of ***p < 0.005.
Figure 3
Figure 3
Examples of amygdala RE neurons. Firing rates in all correct trials of a session are cumulated and smoothed separately under the H-RP and L-RP conditions. (A) Example of RE positive neuron, which fired more frequently for the rat under the H-RP condition than the L-RP condition. The time of zero is the time when the rat poked its nose into the selected hole. The period of significantly (p < 0.05) higher firing rate under the H-RP condition is indicated by the red horizontal line at the top of the graph. (B) Example of RE negative neuron, which fired more frequently for the rat under the L-RP condition than the H-RP condition. Periods of significantly (p < 0.05) higher firing rates under the L-RP condition are indicated by the blue horizontal lines at the top of the graph.
Figure 4
Figure 4
Examples of hippocampal TP neurons. Same format as Figure 3 except that firing rates are cumulated and smoothed separately when the rats poked their nose into the left or right hole. (A) Example of TP neuron that fired more frequently during the selection period prior to nose-pokes to the right hole. (B) Example of TP neuron that fired more frequently prior to nose-pokes to the left hole.
Figure 5
Figure 5
Proportions of RE neurons and TP neurons in the amygdala and hippocampus. The asterisks indicate a significant difference between RE and TP neurons.
Figure 6
Figure 6
Example of data of LFP coherence and power between the amygdala and the hippocampus. (A) Coherence presented as coherograms under the H-RP (upper) and L-RP (lower) conditions. The ordinates indicate the frequency of coherence. The abscissas indicate the time course and the time of zero is the time when the rat poked its nose into the selected hole. Colors in the graph indicate the strength of coherence. (B) Averaged powers presented as normalized PSDs between H-RP and L-RP conditions in the amygdala (left) and hippocampus (right). Each of the three different bands of oscillation (theta, gamma, and HFOs) was compared. The asterisk indicates a significant difference between H-RP and L-RP. (C) HFO coherences between the amygdala and the hippocampus under H-RP and L-RP conditions. The ordinate indicates the strength of coherence. The abscissa indicates the time course and the time of zero means the time when the rat poked its nose into the selected hole. Periods of significantly (p < 0.05) stronger coherence under the H-RP condition are indicated by the red horizontal lines at the top of the graph. (D) Gamma coherences between the amygdala and the hippocampus under H-RP and L-RP conditions. Same format as (C). (E) Theta coherences between the amygdala and the hippocampus under H-RP and L-RP conditions. Same format as (C). Periods of significantly (p < 0.05) stronger coherence under the L-RP condition are indicated by the blue horizontal lines at the top of the graph.
Figure 7
Figure 7
Correlations between selection time and each of the three distinct bands of coherence (HFOs, gamma, and theta) during ITIs and trials. (A) H-RP condition. The ordinate indicates the correlation presented as r values. The asterisks mean significantly stronger correlation among the three bands of coherence. (B) L-RP condition. Same format as (A). (C) Shifted trials. Same format as (A). (D) Correlations between selection time and theta power in the amygdala and hippocampus during trial periods.
Figure 8
Figure 8
Phase-to-amplitude mean comodulograms plotted for ITIs and trial periods. (A) Within the amygdala under the H-RP (upper) and L-RP (lower) conditions. The ordinates indicate the ranges of frequency bands in fast oscillations modulated by the phase of slow oscillations. The abscissas indicate the ranges of frequency bands in slow oscillations modulating the amplitude of fast oscillations. Colors in the graph indicate the strength of MI. (B) Within the hippocampus. Same format as (A). (C) Mean comodulograms in the hippocampal theta phase and the amygdala HFO amplitude. Same format as (A). (D) Mean comodulograms in the amygdala theta phase and the hippocampal HFO amplitude. Same format as (A). (E) Mean peak MIs of each comodulogram during ITIs (left graph) and the trial periods (right graph). Asterisks indicate significant differences of *p < 0.05.

Similar articles

Cited by

References

    1. Abeles M. (1982). Quantification, smoothing, and confidence limits for single-units' histogram. J. Neurosci. Meth. 5, 317–325 10.1016/0165-0270(82)90002-4 - DOI - PubMed
    1. Ahmed O. J., Mehta M. R. (2012). Running speed alters the frequency of hippocampal gamma oscillations. J. Neurosci. 32, 7373–7383 10.1523/JNEUROSCI.5110-11.2012 - DOI - PMC - PubMed
    1. Bauer E. P., Paz R., Pare D. (2007). Gamma oscillations coordinate amygdalo-rhinal interactions during learning. J. Neurosci. 27, 9369–9379 10.1523/JNEUROSCI.2153-07.2007 - DOI - PMC - PubMed
    1. Belova M. A., Patton J. J., Morrison S. E., Salzman C. D. (2007). Expectation modulates neural reponses to pleasant and aversive stimuli in primate amygdala. Neuron 55, 970–984 10.1016/j.neuron.2007.08.004 - DOI - PMC - PubMed
    1. Benchenane K., Peyrache A., Khamassi M., Tierney P. L., Gioanni Y., Battglia F. P., et al. (2010). Coherent theta oscillations and reorganization of spike timing in the hippocampal-prefrontal network upon learning. Neuron 66, 921–936 10.1016/j.neuron.2010.05.013 - DOI - PubMed