. 2013 Dec 2:7:784.
doi: 10.3389/fnhum.2013.00784. eCollection 2013.

The functional anatomy of attention: a DCM study

Affiliations

The functional anatomy of attention: a DCM study

Harriet R Brown et al. Front Hum Neurosci. .

Abstract

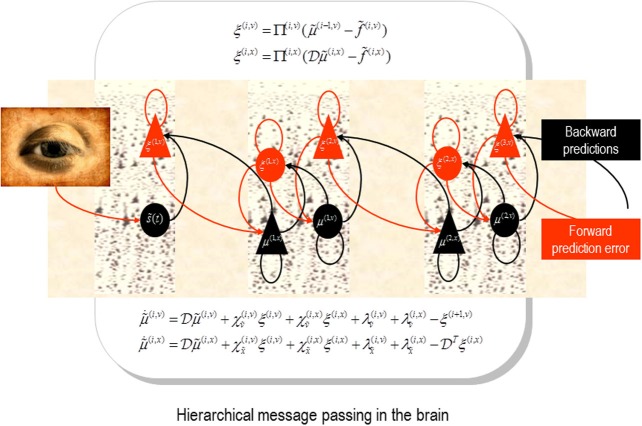
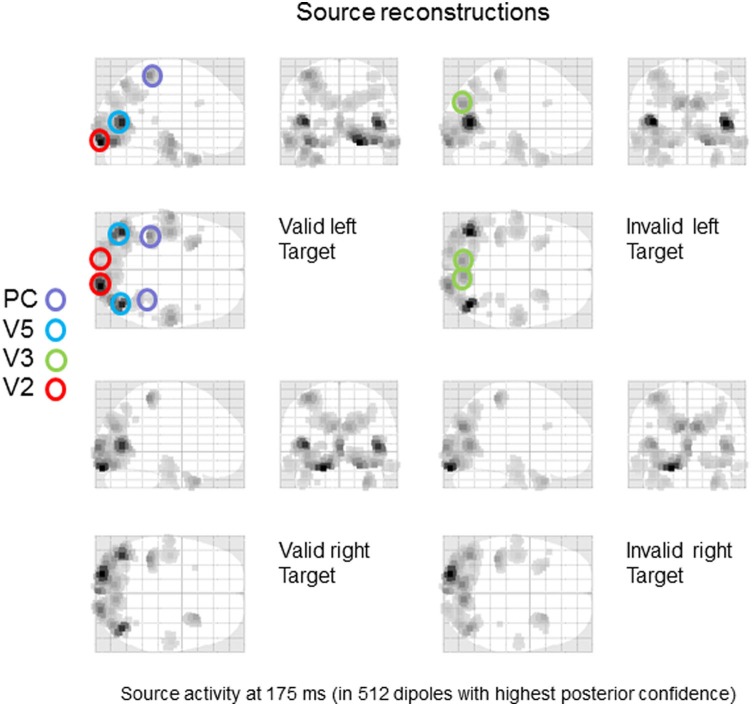
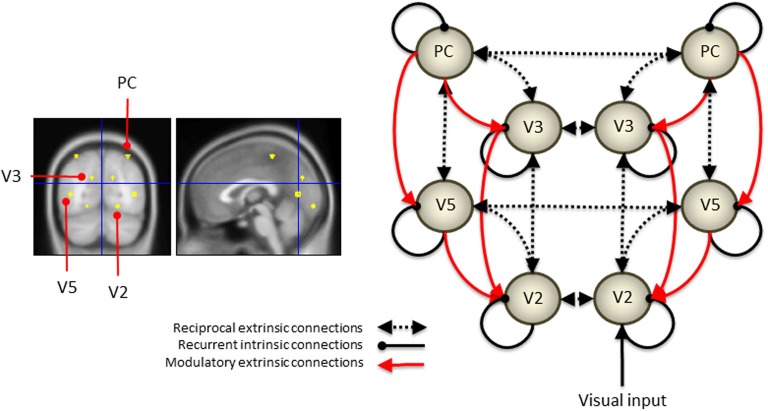
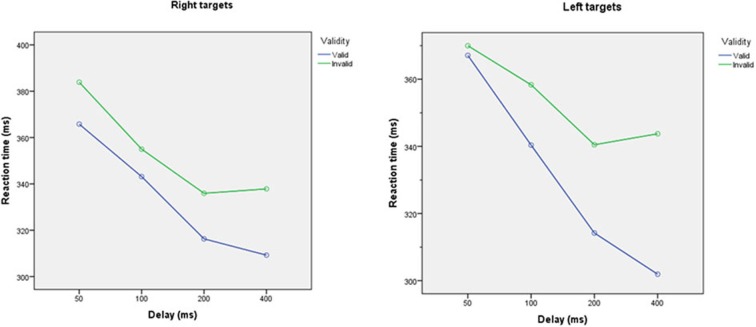
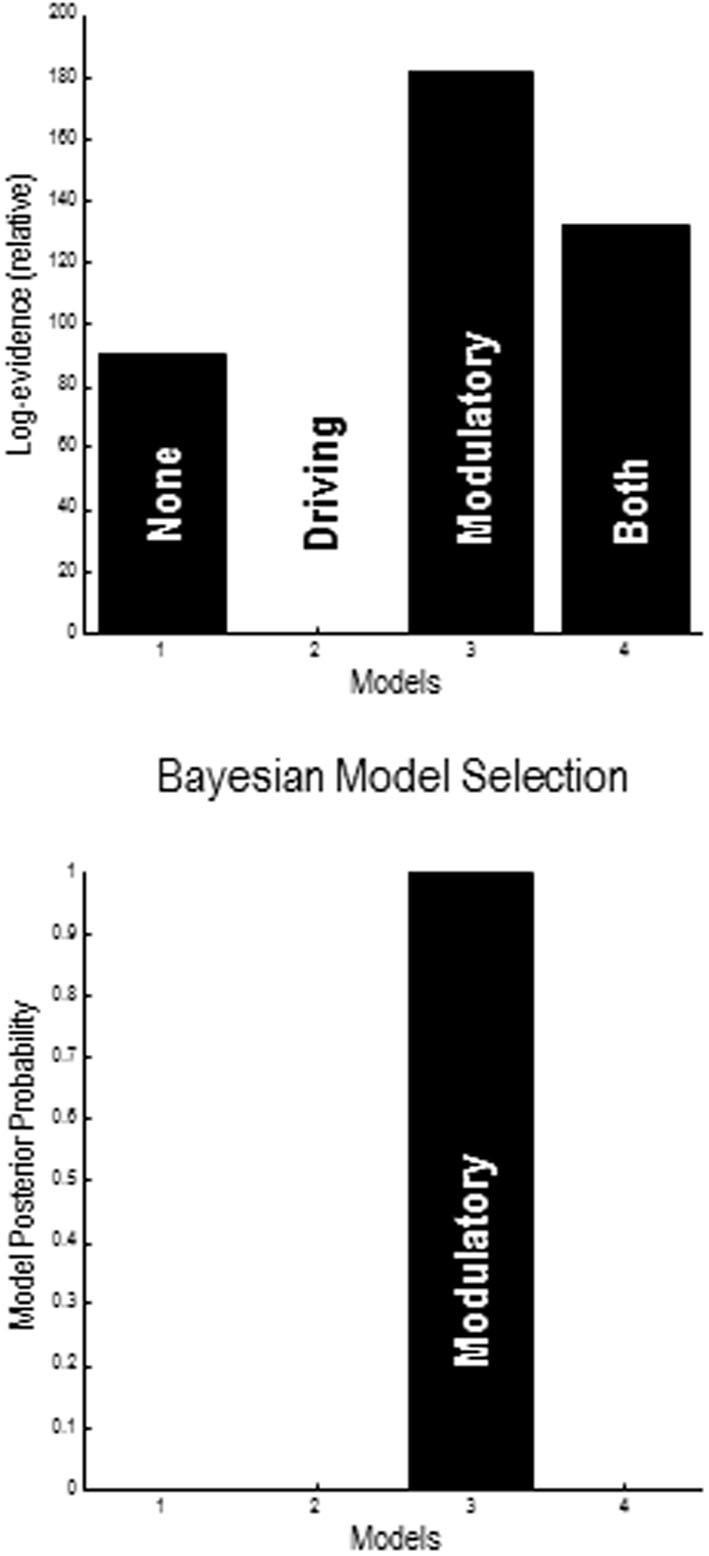
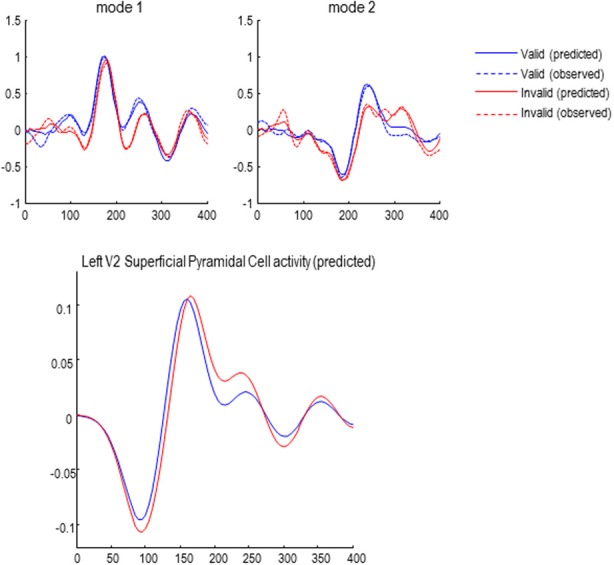
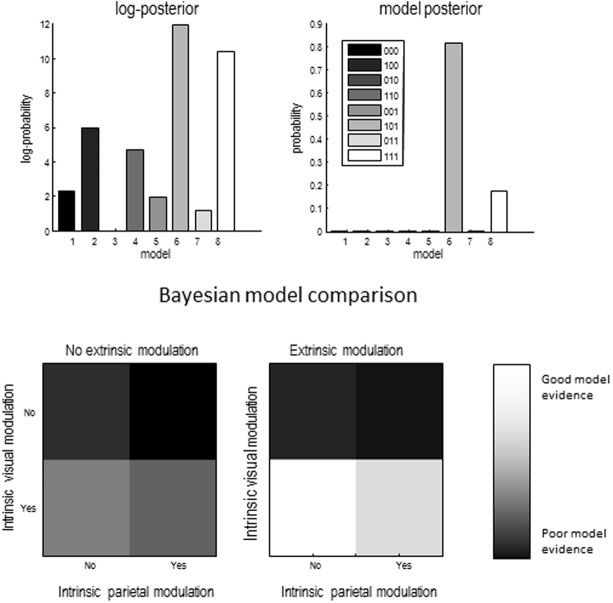
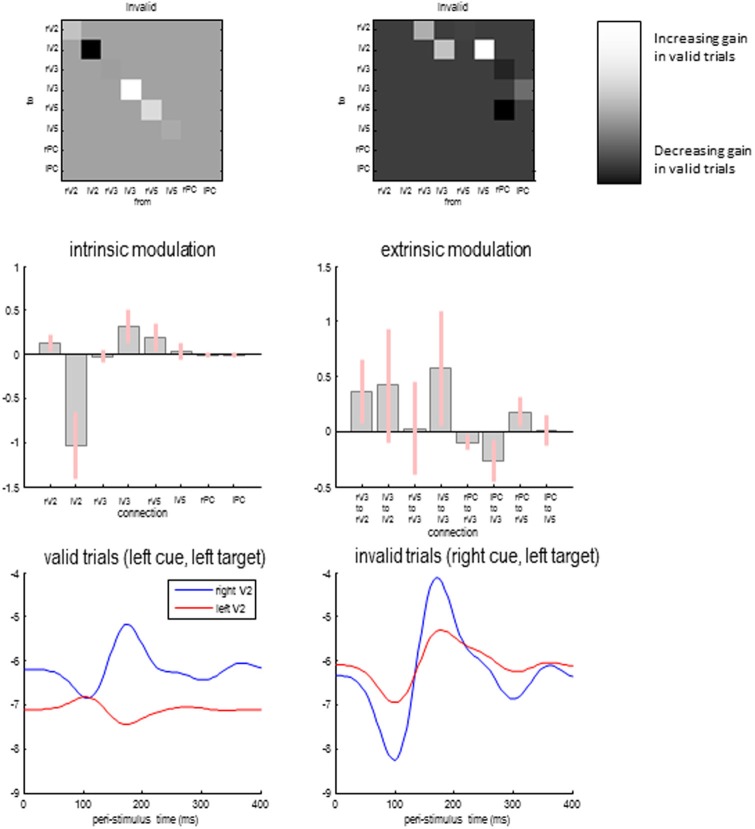
Recent formulations of attention-in terms of predictive coding-associate attentional gain with the expected precision of sensory information. Formal models of the Posner paradigm suggest that validity effects can be explained in a principled (Bayes optimal) fashion in terms of a cue-dependent setting of precision or gain on the sensory channels reporting anticipated target locations, which is updated selectively by invalid targets. This normative model is equipped with a biologically plausible process theory in the form of predictive coding, where precision is encoded by the gain of superficial pyramidal cells reporting prediction error. We used dynamic causal modeling to assess the evidence in magnetoencephalographic responses for cue-dependent and top-down updating of superficial pyramidal cell gain. Bayesian model comparison suggested that it is almost certain that differences in superficial pyramidal cells gain-and its top-down modulation-contribute to observed responses; and we could be more than 80% certain that anticipatory effects on post-synaptic gain are limited to visual (extrastriate) sources. These empirical results speak to the role of attention in optimizing perceptual inference and its formulation in terms of predictive coding.

Keywords: Posner; active inference; attention; cortical gain control; precision; predictive coding.


Figures

Figure 1
Figure 1
Schematic detailing the neuronal architecture that might implement generalized predictive coding. This shows the speculative cells of origin of forward driving connections that convey prediction error from a lower area to a higher area and the backward connections that construct predictions (Mumford, ; Friston et al., 2006). These predictions try to explain away prediction error in lower levels. In this scheme, the sources of forward and backward connections are superficial and deep pyramidal cells respectively. The equations represent a gradient descent on free-energy under a hierarchical dynamic model (see Feldman and Friston, 2010). State-units are in black and error-units in red. Here, neuronal populations are deployed hierarchically within three cortical areas (or macro-columns). Subscripts denote derivatives.
Figure 2
Figure 2
Source specification for dynamic causal modeling. A distributed source reconstruction was performed (Mattout et al., 2006) and the power of evoked responses was quantified over the time course of the trial and all frequencies to yield the maximum intensity projections shown. Eight sources corresponding (roughly) to key maxima of source activity were identified: included bilateral early visual sources (V2); bilateral sources near the occipitotemporal-parietal junction (V5); bilateral dorsal (V3) extrastriate sources and bilateral superior parietal sources (PC).
Figure 3
Figure 3
The location of the eight sources is shown in the panels on the left. To construct the DCM, these sources were connected in the distributed network shown on the right. The parietal sources sent both driving and modulatory backward connections to the extrastriate (V3 and V5) sources that then sent backward connections to the V2 sources. These connections were reciprocated by extrinsic forward connections to produce a simple visual hierarchy with bilateral connections.
Figure 4
Figure 4
Reaction times to validly and invalidly cued targets at different cue-target intervals for targets appearing on the left (left panel) and right (right panel), averaged across all participants. Reaction times were faster for validly than invalidly cued targets (p < 0.0001). Reaction times decreased as cue-target interval increase (all p < 0.05).
Figure 5
Figure 5
Results of provisional Bayesian model selection. The (free energy approximation) to log evidence was assessed for models with and without validity–dependent differences in top-down driving and modulatory connections. The log evidences (upper panel) show that the model with differences in modulatory connections has the greatest posterior probability (lower panel). The log evidences are shown relative to the evidence for a null model with no changes in either driving or modulatory backward connections.
Figure 6
Figure 6
Upper panel: the first two of eight spatial modes (principle components) of the data to which the DCMs were fitted. Observed responses are dashed lines; solid lines show the responses fitted by the winning model (see below), demonstrating a good model fit. Lower panel: reconstructed source activity in left V2.
Figure 7
Figure 7
Upper left panel: relative log evidence for models which fitted differences between conditions through changes in one of three sets of parameters: superficial pyramidal cell gain in visual areas (1 _ _), superficial pyramidal cell gain in parietal areas (_ 1 _) and strength of backwards modulatory connections (_ _ 1). Upper right panel: The winning model had changes in superficial pyramidal cell gain in visual areas and in the strength of backwards modulatory connections, meaning that we can be more than 80% certain that backwards modulatory connections are not necessary explain the electrophysiological signatures of the validity effect. Lower panels show the same data as in the top left panel, but in image format.
Figure 8
Figure 8
Differences in self-inhibition (upper left panels) and backwards modulation of self-inhibition (upper right panels) between valid and invalid trials for the model with the highest posterior probability above. The lower panels show the gain of the superficial pyramidal cells over time in valid and invalid trials.

References

    1. Bastos A. M., Usrey W. M., Adams R. A., Mangun G. R., Fries P., Friston K. J. (2012). Canonical microcircuits for predictive coding. Neuron 76, 695–711 10.1016/j.neuron.2012.10.038 - DOI - PMC - PubMed
    1. Brown H., Friston K. J. (2012a). Free-energy and illusions: the cornsweet effect. Front. Psychol. 3:43 10.3389/fpsyg.2012.00043 - DOI - PMC - PubMed
    1. Brown H., Friston K. J. (2012b). Dynamic causal modelling of precision and synaptic gain in visual perception - an EEG study. Neuroimage 63, 223–231 10.1016/j.neuroimage.2012.06.044 - DOI - PMC - PubMed
    1. Buia C., Tiesinga P. (2006). Attentional modulation of firing rate and synchrony in a model cortical network. J. Comput. Neurosci. 20, 247–264 10.1007/s10827-006-6358-0 - DOI - PubMed
    1. Daunizeau J., Mattout J., Clonda D., Goulard B., Benali H., Lina J. M. (2006). Bayesian spatio-temporal approach for EEG source reconstruction: conciliating ECD and distributed models. IEEE Trans. Biomed. Eng. 53, 503–516 10.1109/TBME.2005.869791 - DOI - PubMed

LinkOut - more resources