. 2013 Nov 27:4:480.
doi: 10.3389/fpls.2013.00480. eCollection 2013.

The GIP gamma-tubulin complex-associated proteins are involved in nuclear architecture in Arabidopsis thaliana

Affiliations

The GIP gamma-tubulin complex-associated proteins are involved in nuclear architecture in Arabidopsis thaliana

Morgane Batzenschlager et al. Front Plant Sci. .

Abstract

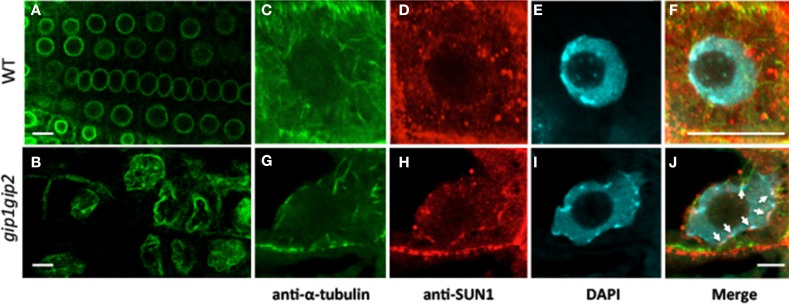
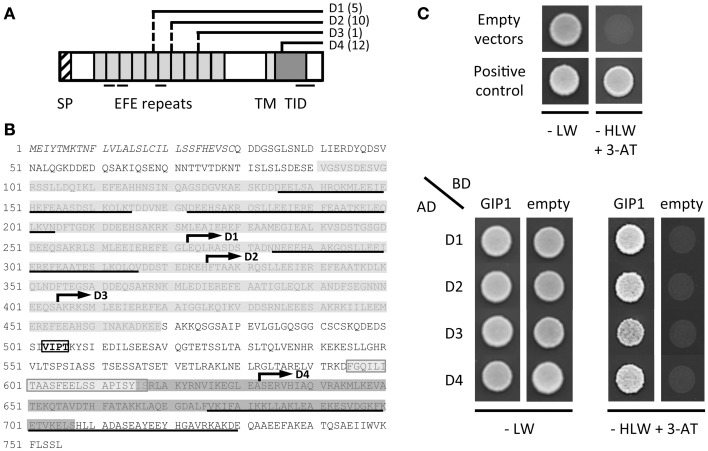
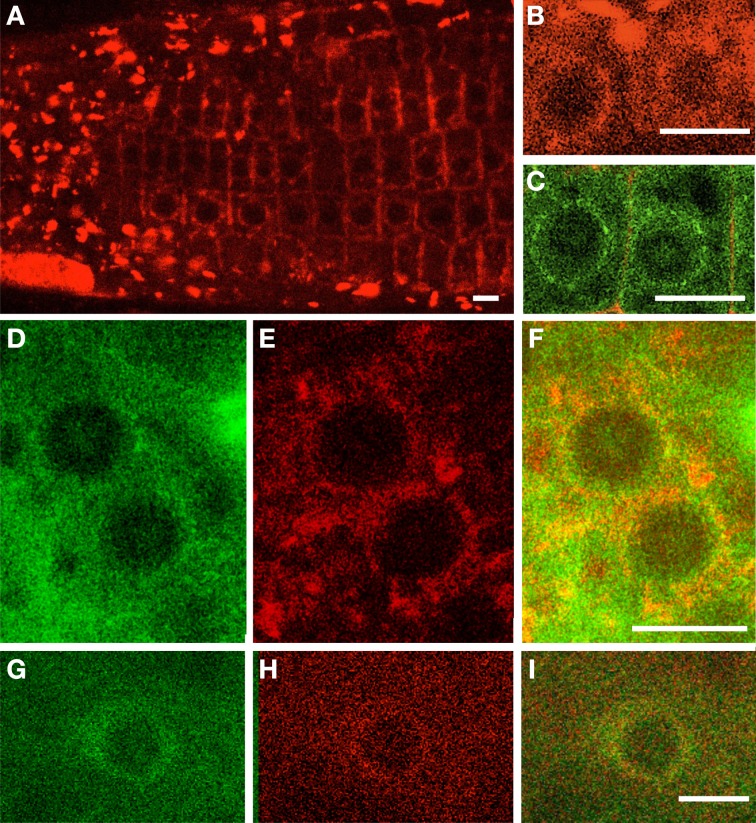
During interphase, the microtubular cytoskeleton of cycling plant cells is organized in both cortical and perinuclear arrays. Perinuclear microtubules (MTs) are nucleated from γ-Tubulin Complexes (γ-TuCs) located at the surface of the nucleus. The molecular mechanisms of γ-TuC association to the nuclear envelope (NE) are currently unknown. The γ-TuC Protein 3 (GCP3)-Interacting Protein 1 (GIP1) is the smallest γ-TuC component identified so far. AtGIP1 and its homologous protein AtGIP2 participate in the localization of active γ-TuCs at interphasic and mitotic MT nucleation sites. Arabidopsis gip1gip2 mutants are impaired in establishing a fully functional mitotic spindle and exhibit severe developmental defects. In this study, gip1gip2 knock down mutants were further characterized at the cellular level. In addition to defects in both the localization of γ-TuC core proteins and MT fiber robustness, gip1gip2 mutants exhibited a severe alteration of the nuclear shape associated with an abnormal distribution of the nuclear pore complexes. Simultaneously, they showed a misorganization of the inner nuclear membrane protein AtSUN1. Furthermore, AtGIP1 was identified as an interacting partner of AtTSA1 which was detected, like the AtGIP proteins, at the NE. These results provide the first evidence for the involvement of a γ-TuC component in both nuclear shaping and NE organization. Functional hypotheses are discussed in order to propose a model for a GIP-dependent nucleo-cytoplasmic continuum.

Keywords: Arabidopsis thaliana; AtGIP1/MOZART1; AtTSA1; gamma-tubulin complex; nuclear envelope.


Figures

Figure 1
Figure 1
Phylogenetic tree of GIP peptidic sequences. Sequences were aligned using T-coffee and Myers-Miller matrix. A tree was constructed using the neighbor joining algorithm. Analyses were performed using the MacVector software. GIP sequences segregate accordingly to the genus of life evolution. This suggests that GIPs probably originate from one and the same ancestor and that they are not the products of a convergent evolution that would result in a mix of the sequences. Accessions numbers of the used sequences are presented in Table S2.
Figure 2
Figure 2
GIP sequences and three dimensional structure. (A) Arabidopsis GIP1 and GIP2 sequence alignment. Comparison (a) between both Arabidopsis sequences and (b) between AtGIP1 and other eukaryotes. (*) identical aminoacids, (:) similar aa, (.) semi-conserved aa. The conserved glycine residue (aa 42) is shown in bold print. (B) The structural integrity of AtGIP1 protein was analyzed using circular dichroism spectroscopy. Spectra were recorded at 25° C using recombinant AtGIP1 solution at 28 μM in 10 mM sodium phosphate buffer (pH 7.4), complemented with 25 mM NaCl and 1 mg/ml of Nvoy polymer. The signal is expressed in mean residue ellipticity (deg.cm2.dmol−1). Experimental data and fitting results are shown in dots and solid line, respectively. Inset shows the residuals using an expanded y-axis to better display the random distribution. (C) An AtGIP protein model generated with the LOMETS online server (http://zhanglab.ccmb.med.umich.edu/LOMETS/) and the methods of LOMETS and MODELLER v9.3 (Wu and Zhang, 2007) in a fully automated procedure. The predicted AtGIP1 3D structure is composed of 3 α-helices (aa 9–20; aa 25–40; aa 45–61).
Figure 3
Figure 3
Nuclear shape and DNA labeling in WT (A–E) and gip1gip2 mutants (F–J) using DAPI staining. (A,F) General view of a root tip. (B,G) Enlarged view of root tip meristematic cells. (C,H) Cotyledon nuclei. (D,I) Leaf nuclei. (E,J) Petal nuclei. The nuclei of gip1gip2 mutant cells exhibit an increased size and are highly deformed. Bars = 5 μm. (K,L) TEM performed on WT and gip1gip2 mutant root tip seedlings, respectively, showing NE deformations in the mutant (L, arrow). Bars = 500 nm.
Figure 4
Figure 4
Modification of NPC distribution in gip1gip2 mutants and AtGIP distribution in cells expressing AtGIP-GFP constructs. (A,B) Tangential views of the nuclear surface in TEM with NPC repartition (white stars) which is regular in WT (A). Heterogenous distribution of NPCs and abnormal shaped NPCs (white arrows) in gip1gip2 mutants (B). (C) Analysis of the distances between NPCs in WT and mutants (p-value < 0.001). (D) Quantification of NPC number per μm2 in WT and mutants. (E) Quantification of abnormal NPCs. (F–H) Immunolabeling using anti-GFP antibodies (arrowheads) on cells expressing AtGIP1-GFP (F) or AtGIP2-GFP (H) and WT control cells (G). (I) The quantification of gold particles was performed on 50 images corresponding to 3 independent experiments. Control cells which do not express a GFP fusion protein were labeled in parallel. Counting was performed in different subcellular compartments (Cytoplasm: cyto, NE and Nucleoplasm: Nu). Bars = 500 nm.
Figure 5
Figure 5
Modification of the NE shape and organization. AtSUN1-YFP reveals the INM when expressed in WT Arabidopsis (A) and gip1gip2 mutants (B). Note the altered nuclear shape with lobulations, and mislocalization of AtSUN1 in the nucleoplasm of mutant cells. Immunostaining of endogenous AtSUN1 (D,H) compared with MTs (C,G) and DAPI-stained DNA (E,I) in WT and gip1gip2 root nuclei, respectively. Corresponding merged pictures (F,J) show a disrupted perinuclear localization of AtSUN1 in gip1gip2 mutants (J, arrows) compared to WT (F). Bars = 10 μm.
Figure 6
Figure 6
AtGIP1 interacts with C-terminal domains of AtTSA1 in a yeast two-hybrid system. (A) Schematic representation of AtTSA1 protein and corresponding C-terminal domains identified by yeast two-hybrid screening. The features of AtTSA1 protein have been initially described in Suzuki et al. (2005). SP, signal peptide; EFE repeats, multimerization and calcium-binding repeat sequence; TM, putative transmembrane domain; TID, TSK-interacting domain. Several coiled-coil motifs predicted by the Paircoil2 software (McDonnell et al., 2006) are also underlined. D1 to D4 regions correspond to the C-terminal portion of AtTSA1 with varying lengths toward the N-terminus (depicted by solid and dashed lines). Corresponding cDNAs have been repeatedly identified by yeast two-hybrid screening using AtGIP1 as a bait (the number of positive clones identified for each domain is indicated in brackets). (B) AtTSA1 amino acid sequence. Features of the protein represented in (A) are reported on AtTSA1 primary sequence as follows: SP (italics), EFE repeats (gray), TM (light gray), TID (dark gray), coiled-coil motifs (underlined). D1 to D4 domains are indicated by an arrow starting from the first corresponding amino acid (D1: 273 to 755; D2: 326 to 755; D3: 405 to 755; D4: 633 to 755). VIPT motif (boxed text): putative NE localization signal (Zhou et al., ; see text). (C) Interaction of AtGIP1 with AtTSA1 domains in a yeast two-hybrid assay. AH109 cells co-transformed with bait (Gal4 Binding Domain, BD) and prey (Gal4 Activation Domain, AD) recombinant plasmids were spotted directly on control (−LW) and selection (−HLW + 3-AminoTriazole, 3-AT) plates and grown for 2 days at 30°C. Upper panel: negative (empty vectors) and positive (pBWRepA/pGADRb1; Xie et al., 1996) interaction controls. Lower panel: interaction test. Transformants coding for D1 to D4 C-terminal regions of AtTSA1 grow in the presence of AtGIP1 on selective medium, indicating an interaction between the different proteins.
Figure 7
Figure 7
Distribution of AtGIP and AtTSA1 in Arabidopsis root cells. 35S::AtTSA1-RFP (A,B) and 35S::AtGIP1-GFP (C) constructs were expressed independently or simultaneously (D–I) in Arabidopsis rootlets. Individual pictures of AtGIP1-GFP (D,G), AtTSA1-RFP (E,H) localization are merged (F,I). AtTSA1 localizes in ER body-like structures and at the nuclear periphery (A,B,E,H). AtGIPs and AtTSA1 proteins localize at the NE. Colocalization is observed on the merged images (F,I). Bars = 10 μm.

Similar articles

Cited by

References

    1. Bajer A., Mole-Bajer J. (1969). Formation of spindle fibers, kinetochore orientation, and behavior of the nuclear envelope during mitosis in endosperm. Chromosoma 27, 448–484 10.1007/BF00325682 - DOI
    1. Burke B., Ellenberg J. (2002). Remodelling the walls of the nucleus. Nat. Rev. Mol. Cell. Biol. 3, 487–497 10.1038/nrm860 - DOI - PubMed
    1. Canaday J., Stoppin-Mellet V., Mutterer J., Lambert A., Schmit A. (2000). Higher plant cells: gamma-tubulin and microtubule nucleation in the absence of centrosomes. Microsc. Res. Tech. 49, 487–495 10.1002/(SICI)1097-0029(20000601)49:5<487::AID-JEMT11>3.0.CO;2-I - DOI - PubMed
    1. Ciska M., Moreno Diaz de la Espina S. (2013). NMCP/LINC proteins: putative lamin analogs in plants? Plant signal. Behav. 8 Available online at: http://www.ncbi.nlm.nih.gov/pubmed/24128696 10.4161/psb.26669 - DOI - PMC - PubMed
    1. Clough S., Bent A. (1998). Floral dip: a simplified method for Agrobacterium-mediated transformation of Arabidopsis thaliana. Plant J. 16, 735–743 10.1046/j.1365-313x.1998.00343.x - DOI - PubMed