. 2013 Dec 2:4:260.
doi: 10.3389/fgene.2013.00260. eCollection 2013.

Gene genealogies for genetic association mapping, with application to Crohn's disease

Affiliations

Gene genealogies for genetic association mapping, with application to Crohn's disease

Kelly M Burkett et al. Front Genet. .

Abstract

A gene genealogy describes relationships among haplotypes sampled from a population. Knowledge of the gene genealogy for a set of haplotypes is useful for estimation of population genetic parameters and it also has potential application in finding disease-predisposing genetic variants. As the true gene genealogy is unknown, Markov chain Monte Carlo (MCMC) approaches have been used to sample genealogies conditional on data at multiple genetic markers. We previously implemented an MCMC algorithm to sample from an approximation to the distribution of the gene genealogy conditional on haplotype data. Our approach samples ancestral trees, recombination and mutation rates at a genomic focal point. In this work, we describe how our sampler can be used to find disease-predisposing genetic variants in samples of cases and controls. We use a tree-based association statistic that quantifies the degree to which case haplotypes are more closely related to each other around the focal point than control haplotypes, without relying on a disease model. As the ancestral tree is a latent variable, so is the tree-based association statistic. We show how the sampler can be used to estimate the posterior distribution of the latent test statistic and corresponding latent p-values, which together comprise a fuzzy p-value. We illustrate the approach on a publicly-available dataset from a study of Crohn's disease that consists of genotypes at multiple SNP markers in a small genomic region. We estimate the posterior distribution of the tree-based association statistic and the recombination rate at multiple focal points in the region. Reassuringly, the posterior mean recombination rates estimated at the different focal points are consistent with previously published estimates. The tree-based association approach finds multiple sub-regions where the case haplotypes are more genetically related than the control haplotypes, and that there may be one or multiple disease-predisposing loci.

Keywords: Crohn's disease; Markov chain Monte Carlo; association study; coalescent model; fuzzy p-value; gene genealogy.


Figures

Figure 1
Figure 1
Illustration of bipartition clustering. The tree is cut at an internal branch of the tree (orange line). The tips of the tree descending from that branch form one group (orange box) and the tips of the tree that do not descend from that branch form the second group (two blue boxes).
Figure 2
Figure 2
Plot of recombination rate values, ρ, estimated by sampletrees and by HapMap. Solid curve: average of the sampled ρ values from sampletrees for each focal point; Dashed curve: rescaled recombination rates estimated from Phase I HapMap data (release 16a) (International HapMap Consortium, 2005). The tickmarks at the bottom show the marker locations.
Figure 3
Figure 3
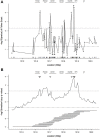
Plot of association results in the 5q31 region. (A) Single-SNP analysis: plot shows −log10(p-value) from Fisher's exact test of association between allelic state and case/control status. The tickmarks at the base of the plot show the locations of the SNPs. (B) Tree-based analysis: −log10 of the median of the fuzzy p-value by focal point. In (B), the tiled horizontal line segments under the association curve show the window spans for every second focal point. In both panels, gene locations are indicated at the top of each panel. The horizontal dotted line near y = 3.3 indicates a p-value of 0.05 after Bonferroni correction, and the horizontal dashed line near y = 1.3 is the uncorrected p-value threshold of 0.05. The Bonferroni correction for (A) is based on 103 SNPs and for (B) it is based on 100 focal points. The triangles in (B) correspond to the peaks of (A).
Figure 4
Figure 4
Plot of −log10 of the p-values from the TDTHAP analysis using a window size of 20 SNPs (blue solid line). The open circles and the dashed line give the single-SNP and tree-based results, respectively, that were also shown in Figure 3. Gene boundaries are marked by horizontal line segments at the top of the plot.
Figure 5
Figure 5
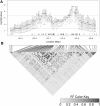
(A) Plot summarizing the distribution of the latent p-values by focal point. The inter-quartile range (IQR) of the latent p-values at each focal point is indicated by the solid vertical line. The filled in circle is the median and the open circle is the 90th percentile of the distribution. The dashed vertical line therefore indicates the range from the 75th to 90th percentile. The dashed horizontal line indicates a p-value cutoff of 0.05 and the dotted horizontal line shows a p-value cutoff of 0.0005 (0.05, Bonferroni-corrected for 100 focal points). SNP locations are marked by tickmarks at the base of the plot. (B) Heatmap of linkage disequilibrium (R2) between SNPs estimated from control haplotypes and displayed by LDheatmap (Shin et al., 2006). The relative positions of the SNPs are given by the horizontal line above the heatmap and the positions are aligned with (A).
Figure 6
Figure 6
Plot summarizing the distribution of the latent p-values by focal point for the permuted case-control labels on haplotypes. The interquartile range (IQR) at each focal point is indicated by the solid vertical line, the filled in circle is the median, and the open circles represent the 10th and 90th percentiles of the distribution of −log10 of the latent p-values. The dashed horizontal line indicates a p-value cutoff of 0.05 and the dotted horizontal line shows a p-value cutoff of 0.0005 (Bonferroni corrected for 100 focal points). For all focal points, the 90th percentile of the distribution of −log10 of the latent p-values is below the 0.05 cutoff.

Similar articles

Cited by

References

    1. Adhikari K., AlChawa T., Ludwig K., Mangold E., Laird N., Lange C. (2012). Is it rare or common? Genet. Epidemiol. 36, 419–429 10.1002/gepi.21637 - DOI - PMC - PubMed
    1. Bardel C., Danjean V., Hugot J., Darlu P., Génin E. (2005). On the use of haplotype phylogeny to detect disease susceptibility loci. BMC Genet. 6:24 10.1186/1471-2156-6-24 - DOI - PMC - PubMed
    1. Barrett M., Chandra S. B. (2011). A review of major Crohn's disease susceptibility genes and their role in disease pathogenesis. Genes Genom. 33, 317–325 10.1007/s13258-011-0076-3 - DOI
    1. Browning B. L., Browning S. R. (2009). A unified approach to genotype imputation and haplotype-phase inference for large data sets of trios and unrelated individuals. Am. J. Hum. Genet. 84, 210–223 10.1016/j.ajhg.2009.01.005 - DOI - PMC - PubMed
    1. Browning S. R. (2006). Multilocus association mapping using variable-length markov chains. Am. J. Hum. Genet. 78, 903–913 10.1086/503876 - DOI - PMC - PubMed