Review
. 2013 Dec 3:4:262.
doi: 10.3389/fgene.2013.00262.

On protocols and measures for the validation of supervised methods for the inference of biological networks

Affiliations
Review

On protocols and measures for the validation of supervised methods for the inference of biological networks

Marie Schrynemackers et al. Front Genet. .

Abstract

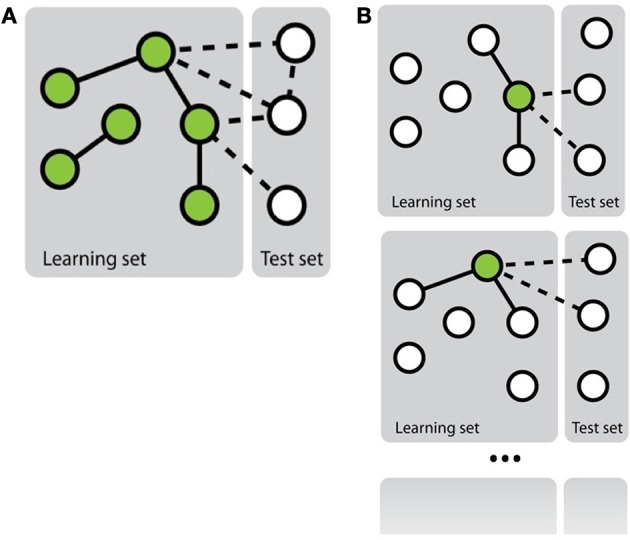
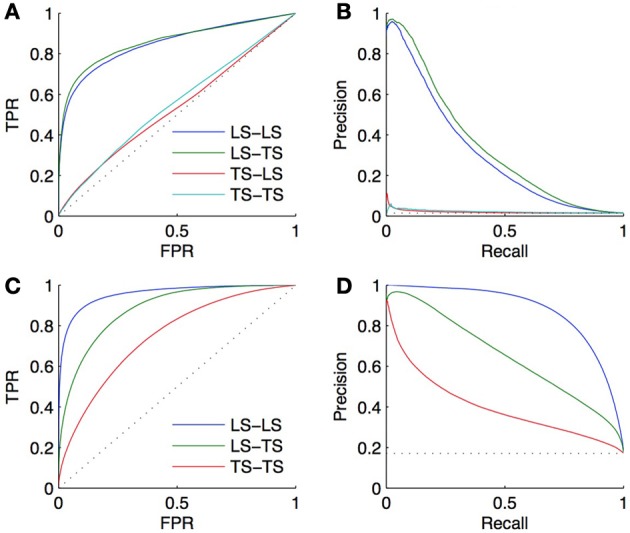
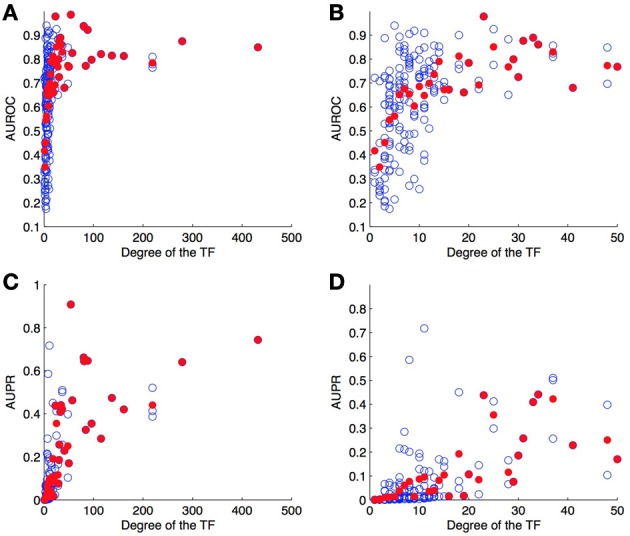
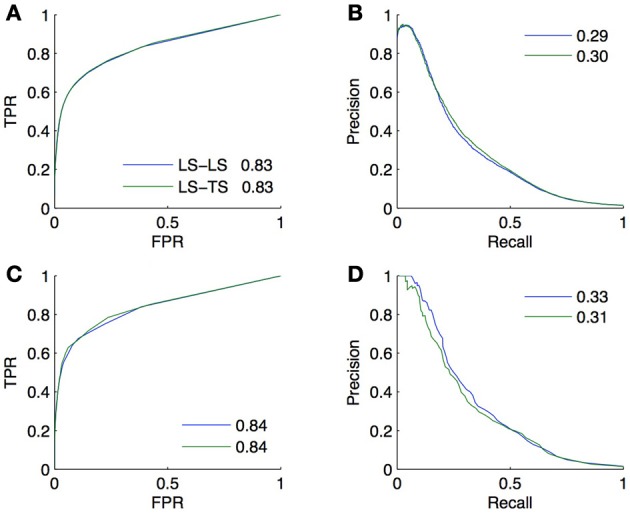
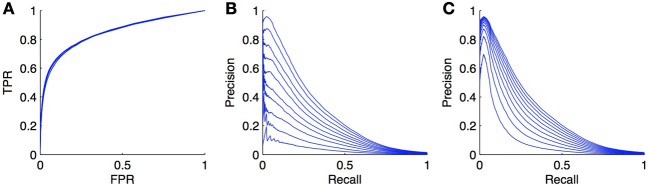
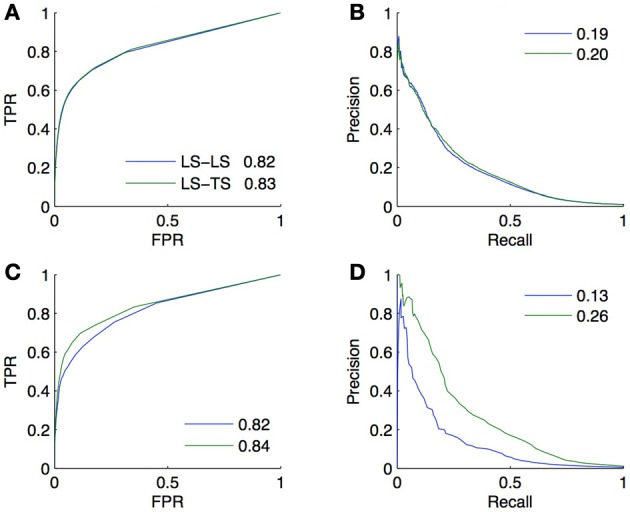
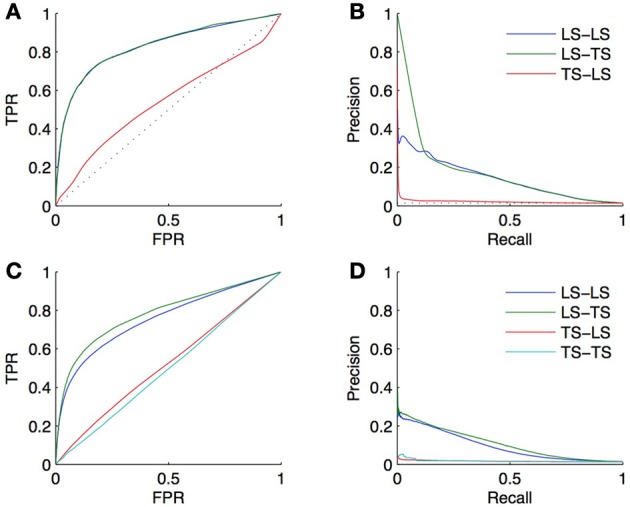
Networks provide a natural representation of molecular biology knowledge, in particular to model relationships between biological entities such as genes, proteins, drugs, or diseases. Because of the effort, the cost, or the lack of the experiments necessary for the elucidation of these networks, computational approaches for network inference have been frequently investigated in the literature. In this paper, we examine the assessment of supervised network inference. Supervised inference is based on machine learning techniques that infer the network from a training sample of known interacting and possibly non-interacting entities and additional measurement data. While these methods are very effective, their reliable validation in silico poses a challenge, since both prediction and validation need to be performed on the basis of the same partially known network. Cross-validation techniques need to be specifically adapted to classification problems on pairs of objects. We perform a critical review and assessment of protocols and measures proposed in the literature and derive specific guidelines how to best exploit and evaluate machine learning techniques for network inference. Through theoretical considerations and in silico experiments, we analyze in depth how important factors influence the outcome of performance estimation. These factors include the amount of information available for the interacting entities, the sparsity and topology of biological networks, and the lack of experimentally verified non-interacting pairs.

Keywords: ROC curves; biological network inference; cross-validation; evaluation protocols; precision-recall curves; supervised learning.


Figures

Figure 1
Figure 1
Schematic representation of the two main approaches to solve the problem of network inference. (A) The global approach that solves a single supervised learning problem by considering each pair as an object for the learning. (B) The local approach that solves several supervised learning problems, each defined by a different node.
Figure 2
Figure 2
ROC curve (A), precision-recall curve (B), lift chart (C), and DET curve (D) for the scores of the table above.
Figure 3
Figure 3
ROC curve (A) and PR curve (B) for a list of scores where negative examples were tripled with respect to scores of Figure 2. The comparison with the curves in Figure 2 shows that the ROC curve is unchanged and that the PR curve degrades, as a consequence of tripling the negatives.
Figure 4
Figure 4
Schematic representation of known and unknown pairs in the network adjacency matrix (A) and of the two kinds of CV, CV on pairs (B) and CV on nodes (C). In (A): known pairs (that can be interacting or not) are in white and unknown pairs, to be predicted, are in gray. Rows and columns of the adjacency matrix have been rearranged to highlight the four families of unknown pairs described in the text: LSr × LSc, LSr × TSc, TSr × LSc, and TSr × TSc. In (B),(C): pairs from the learning fold are in white and pairs from the test fold are in blue. Pairs in gray represent unknown pairs that do not take part to the CV.
Figure 5
Figure 5
ROC curves (A) and PR curves (B) for the four groups of predictions obtained by 10-fold CV on the DREAM5 artificial gene regulatory network. AUROC are, respectively, equal to 0.85, 0.86, 0.53, and 0.55 and AUPR are equal to 0.31, 0.34, 0.02, and 0.02. The performance of prediction of a pair involving a gene and a TF present in the learning set (LS × LS) is as good as the performance of prediction of a pair involving a gene absent and a TF present in the learning set (LS × TS). On the contrary, predicting an interaction involving a new TF is much more difficult (TS × LS and TS × TS). Bottom: ROC curves (C) and PR curves (D) obtained by 10-fold CV on the corresponding DREAM5 co-regulatory network. AUROC are, respectively, equal to 0.96, 0.88, and 0.75 and AUPR are equal to 0.88, 0.65, and 0.40. Predictions on pairs involving two genes from the learning set are the best, while predictions on pairs involving two genes from the test set are the worst.
Figure 6
Figure 6
AUROC (A,B) and AUPR (C,D) for each TF as a function of its degree (number of targets) on the DREAM5 network. Each value was obtained by 10-fold CV on genes. Each blue point corresponds to a particular TF and plots its average AUROC or AUPR value over the 10-folds. Each red point correspond to the average AUROC or AUPR values over all TFs of the corresponding degree. Globally, the higher the degree, the higher are the areas under the curve and so the better are the predictions.
Figure 7
Figure 7
Comparison of the CV estimates of the LS × LS and LS × TS scores, ROC curve in (A) and PR curve in (B), with true score values for the same two families of predictions, ROC curve in (C) and PR curve in (D). AUROC and AUPR values are found in the legends.
Figure 8
Figure 8
Effect of false negatives on ROC and PR curves. We simulated false negatives in the DREAM5 regulatory network, during the testing stage. The ratio of false negatives does not influence the ROC curve (A), but the PR curve (B) decreases while the ratio of positives turned into negatives increases. The ratio varies from 0 to 0.9. Curves (C) show the evolution of the PR curve when the ratio P/N is set similarly as in (B). Although the PR curve degrades also in this case, the degradation is not as important as when false negatives are introduced.
Figure 9
Figure 9
Comparison of the CV estimates of the LS × LS and LS × TS scores, ROC curve in (A) and PR curve in (B), with true score values for the same two families of predictions, ROC curve in (C) and PR curve in (D), when only positive and unlabeled pairs are available. AUROC and AUPR values are found in the legends.
Figure 10
Figure 10
The heavy-tailed degree distribution of many biological networks can lead to better than random predictions, only by exploiting the network topology and ignoring node or pair features. First row: ROC curves (A) and PR curves (B) obtained from predictions made on the DREAM5 dataset using the degree of the nodes in the learning set. Second row: ROC curves (C) and PR curves (D) obtained from predictions made on the DREAM5 dataset when randomly permuting the feature vectors relative to different nodes.

Similar articles

Cited by

References

    1. Bauer T., Eils R., Konig R. (2011). Rip: the regulatory interaction predictor–a machine learning-based approach for predicting target genes of transcription factors. Bioinformatics 27, 2239–2247 10.1093/bioinformatics/btr366 - DOI - PubMed
    1. Ben-Hur A., Noble W. (2006). Choosing negative examples for the prediction of protein-protein interactions. BMC Bioinformatics 7(Suppl. 1):S2 10.1186/1471-2105-7-S1-S2 - DOI - PMC - PubMed
    1. Bleakley K., Biau G., Vert J.-P. (2007). Supervised reconstruction of biological networks with local models. Bioninformatics 23, i57–i65 10.1093/bioinformatics/btm204 - DOI - PubMed
    1. Bleakley K., Yamanishi Y. (2009). Supervised prediction of drug-target interactions using bipartite local models. Bioinformatics 25, 2397–2403 10.1093/bioinformatics/btp433 - DOI - PMC - PubMed
    1. Breiman L. (2001). Random forests. Mach. Learn. 45, 5–32 10.1023/A:1017934522171 - DOI