

Dominant fecal microbiota in newly diagnosed untreated inflammatory bowel disease patients
- PMID: 24348539
- PMCID: PMC3855989
- DOI: 10.1155/2013/636785
Dominant fecal microbiota in newly diagnosed untreated inflammatory bowel disease patients
Abstract
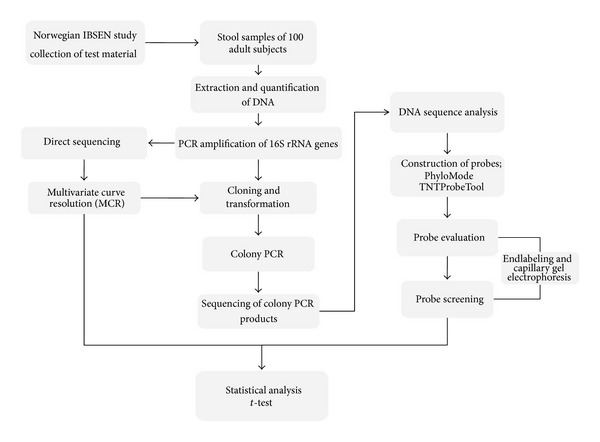
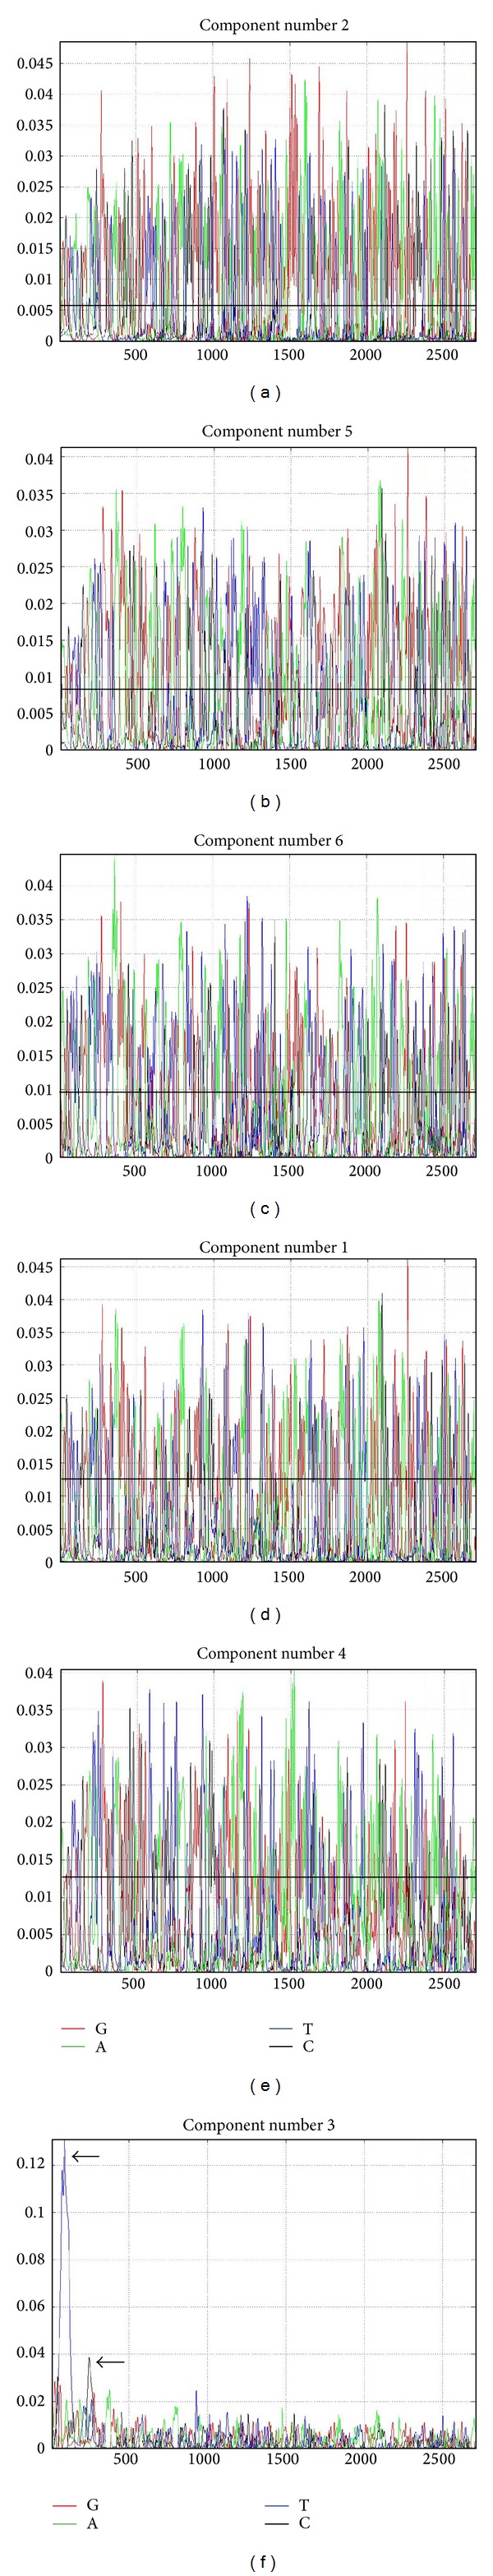
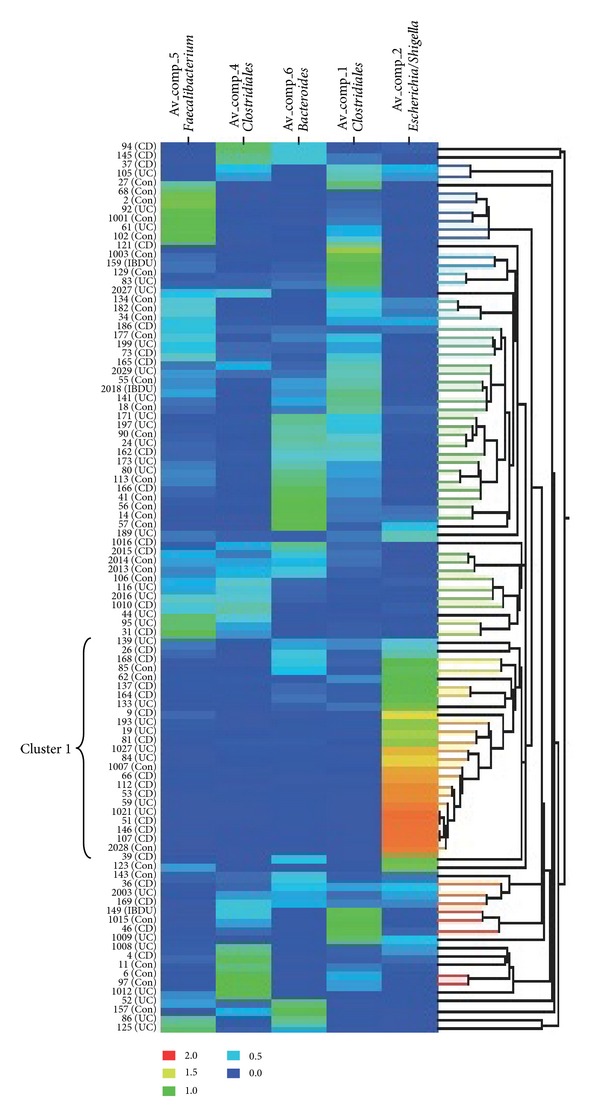
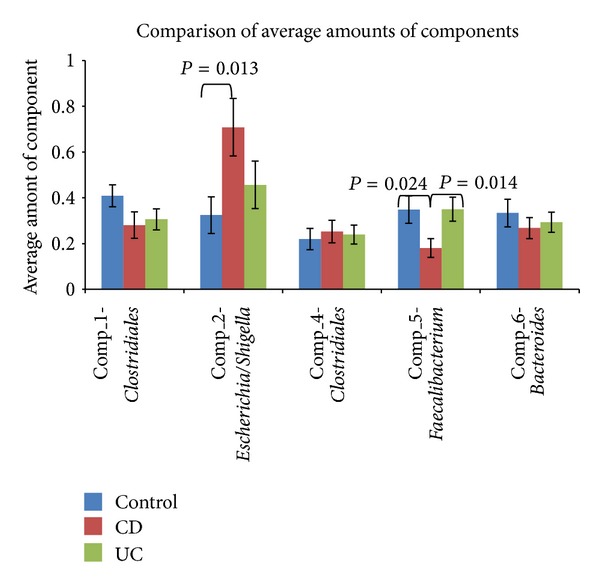
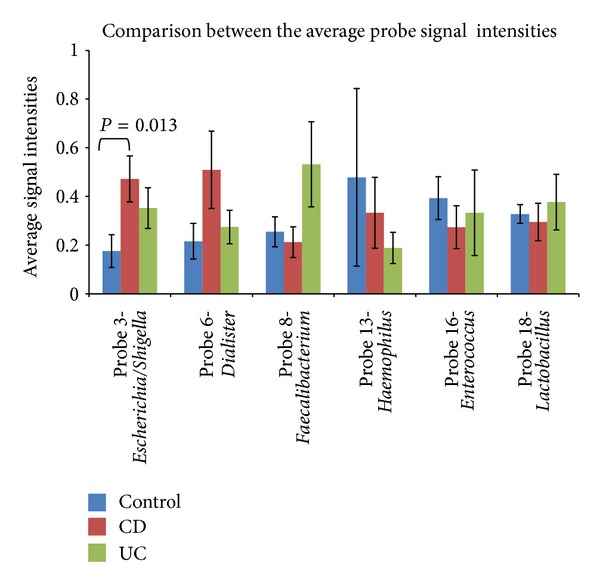
Our knowledge about the microbiota associated with the onset of IBD is limited. The aim of our study was to investigate the correlation between IBD and the fecal microbiota for early diagnosed untreated patients. The fecal samples used were a part of the Inflammatory Bowel South-Eastern Norway II (IBSEN II) study and were collected from CD patients (n = 30), UC patients (n = 33), unclassified IBD (IBDU) patients (n = 3), and from a control group (n = 34). The bacteria associated with the fecal samples were analyzed using a direct 16S rRNA gene-sequencing approach combined with a multivariate curve resolution (MCR) analysis. In addition, a 16S rRNA gene clone library was prepared for the construction of bacteria-specific gene-targeted single nucleotide primer extension (SNuPE) probes. The MCR analysis resulted in the recovery of five pure components of the dominant bacteria present: Escherichia/Shigella, Faecalibacterium, Bacteroides, and two components of unclassified Clostridiales. Escherichia/Shigella was found to be significantly increased in CD patients compared to control subjects, and Faecalibacterium was found to be significantly reduced in CD patients compared to both UC patients and control subjects. Furthermore, a SNuPE probe specific for Escherichia/Shigella showed a significant overrepresentation of Escherichia/Shigella in CD patients compared to control subjects. In conclusion, samples from CD patients exhibited an increase in Escherichia/Shigella and a decrease in Faecalibacterium indicating that the onset of the disease is associated with an increase in proinflammatory and a decrease in anti-inflammatory bacteria.
Figures
Similar articles
-
Fecal Microbiota Signatures Are Associated with Response to Ustekinumab Therapy among Crohn's Disease Patients.mBio. 2018 Mar 13;9(2):e02120-17. doi: 10.1128/mBio.02120-17. mBio. 2018. PMID: 29535202 Free PMC article.
-
Specificities of the fecal microbiota in inflammatory bowel disease.Inflamm Bowel Dis. 2006 Feb;12(2):106-11. doi: 10.1097/01.MIB.0000200323.38139.c6. Inflamm Bowel Dis. 2006. PMID: 16432374
-
Age-dependent fecal bacterial correlation to inflammatory bowel disease for newly diagnosed untreated children.Gastroenterol Res Pract. 2013;2013:302398. doi: 10.1155/2013/302398. Epub 2013 Apr 18. Gastroenterol Res Pract. 2013. PMID: 23690761 Free PMC article.
-
Gut microbiota differs between children with Inflammatory Bowel Disease and healthy siblings in taxonomic and functional composition: a metagenomic analysis.Am J Physiol Gastrointest Liver Physiol. 2017 Apr 1;312(4):G327-G339. doi: 10.1152/ajpgi.00293.2016. Epub 2016 Dec 30. Am J Physiol Gastrointest Liver Physiol. 2017. PMID: 28039159
-
The presence of genetic risk variants within PTPN2 and PTPN22 is associated with intestinal microbiota alterations in Swiss IBD cohort patients.PLoS One. 2018 Jul 2;13(7):e0199664. doi: 10.1371/journal.pone.0199664. eCollection 2018. PLoS One. 2018. PMID: 29965986 Free PMC article.
Cited by
-
16S rRNA gene sequencing and healthy reference ranges for 28 clinically relevant microbial taxa from the human gut microbiome.PLoS One. 2017 May 3;12(5):e0176555. doi: 10.1371/journal.pone.0176555. eCollection 2017. PLoS One. 2017. PMID: 28467461 Free PMC article.
-
Modulating Composition and Metabolic Activity of the Gut Microbiota in IBD Patients.Int J Mol Sci. 2016 Apr 19;17(4):578. doi: 10.3390/ijms17040578. Int J Mol Sci. 2016. PMID: 27104515 Free PMC article. Review.
-
The gut microbiota and host health: a new clinical frontier.Gut. 2016 Feb;65(2):330-9. doi: 10.1136/gutjnl-2015-309990. Epub 2015 Sep 2. Gut. 2016. PMID: 26338727 Free PMC article. Review.
-
Interrelationships of the Intestinal Microbiome, Trimethylamine N-Oxide and Lipopolysaccharide-Binding Protein with Crohn's Disease Activity.Pathogens. 2024 Dec 27;14(1):5. doi: 10.3390/pathogens14010005. Pathogens. 2024. PMID: 39860966 Free PMC article.
-
Deviations in human gut microbiota: a novel diagnostic test for determining dysbiosis in patients with IBS or IBD.Aliment Pharmacol Ther. 2015 Jul;42(1):71-83. doi: 10.1111/apt.13236. Epub 2015 May 14. Aliment Pharmacol Ther. 2015. PMID: 25973666 Free PMC article.
References
LinkOut - more resources
Full Text Sources
Other Literature Sources
