

A voxel-map quantitative analysis approach for atherosclerotic noncalcified plaques of the coronary artery tree
- PMID: 24348749
- PMCID: PMC3855949
- DOI: 10.1155/2013/957195
A voxel-map quantitative analysis approach for atherosclerotic noncalcified plaques of the coronary artery tree
Abstract
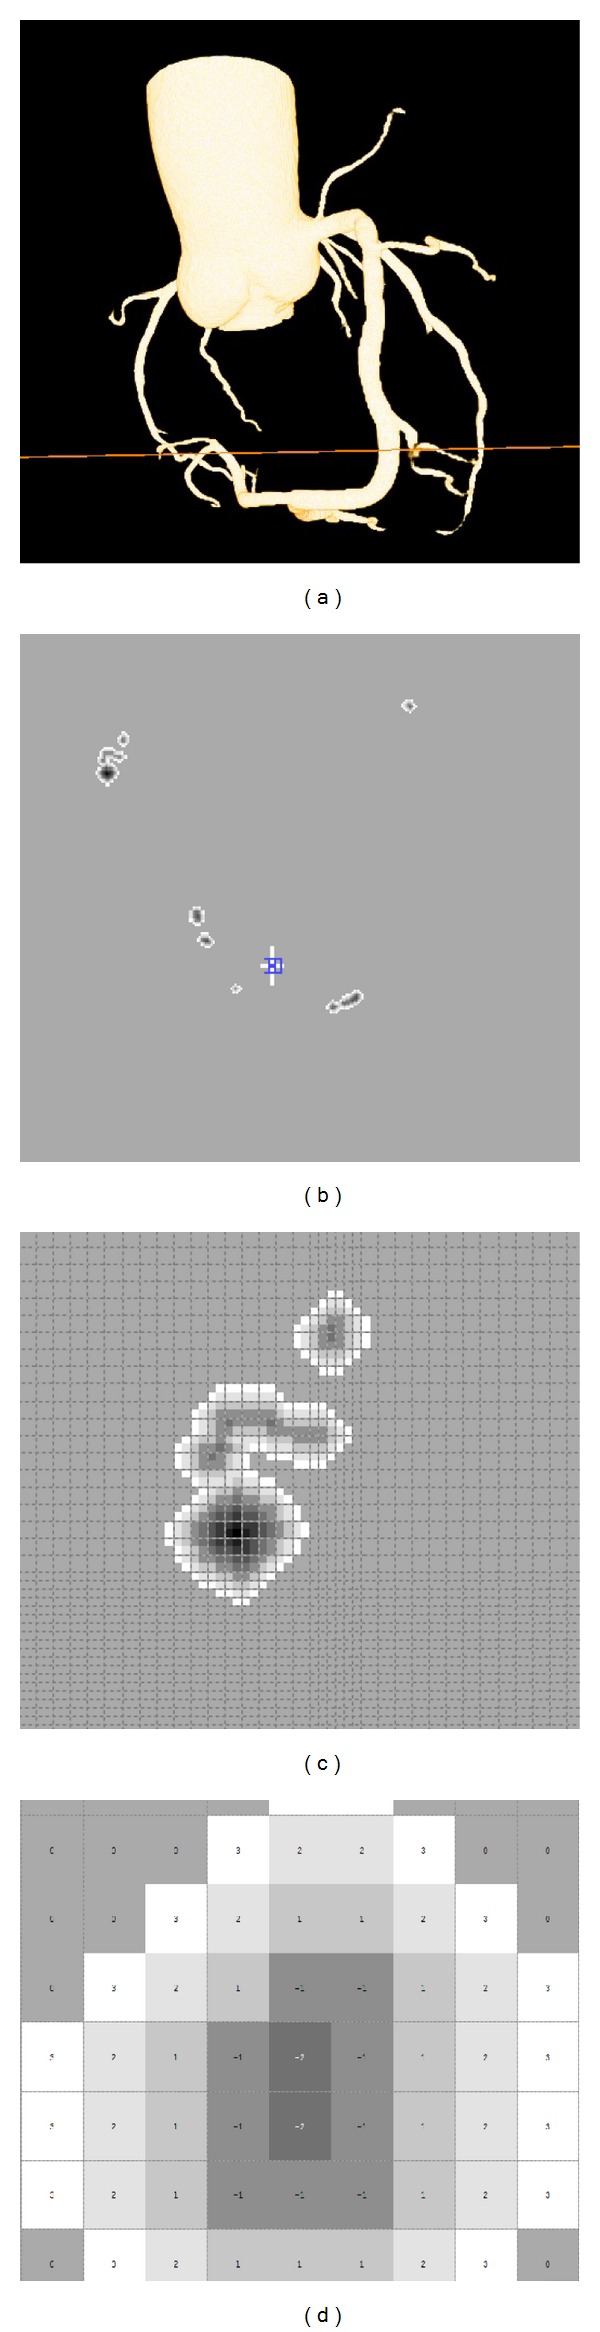
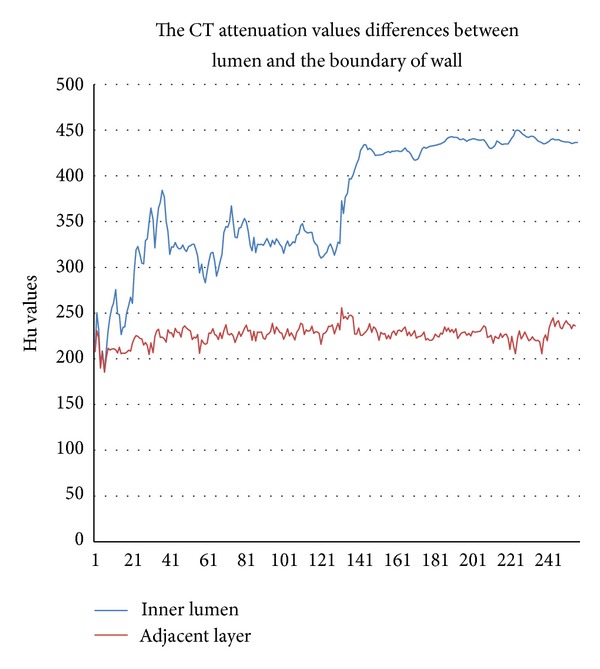
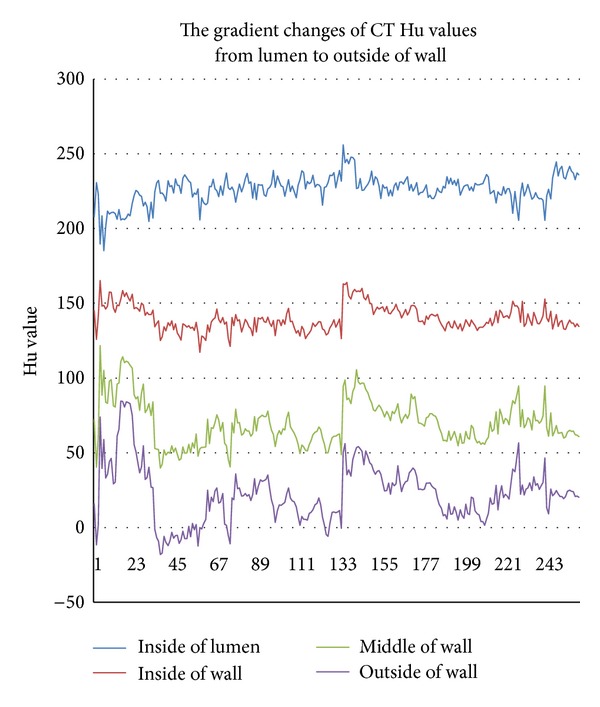
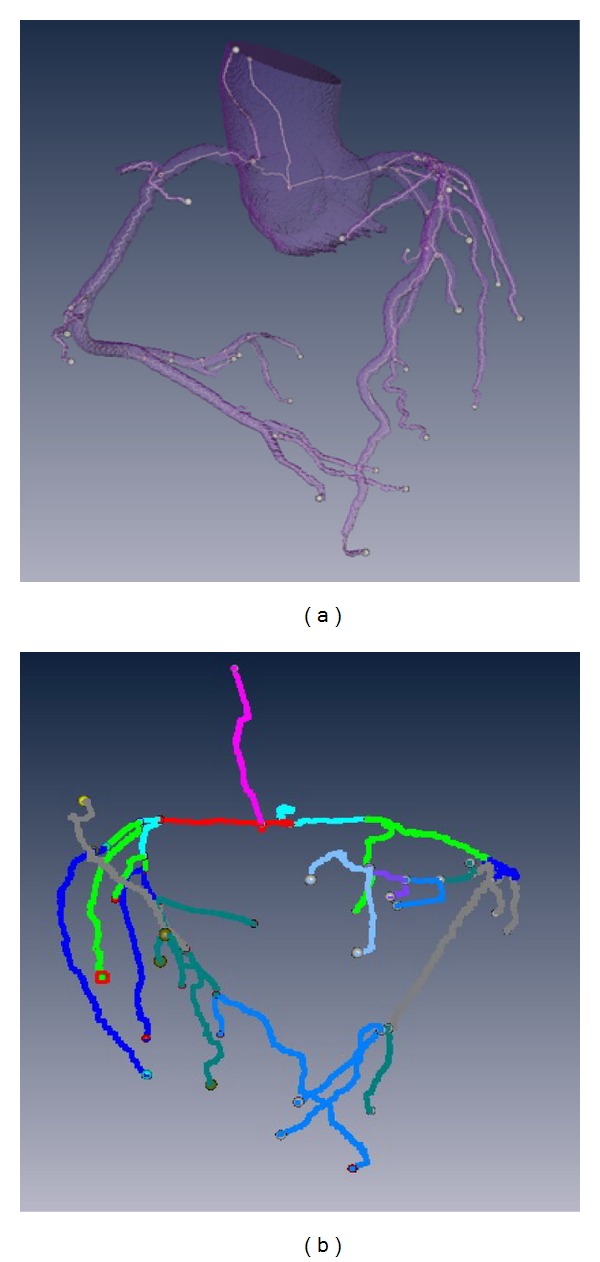
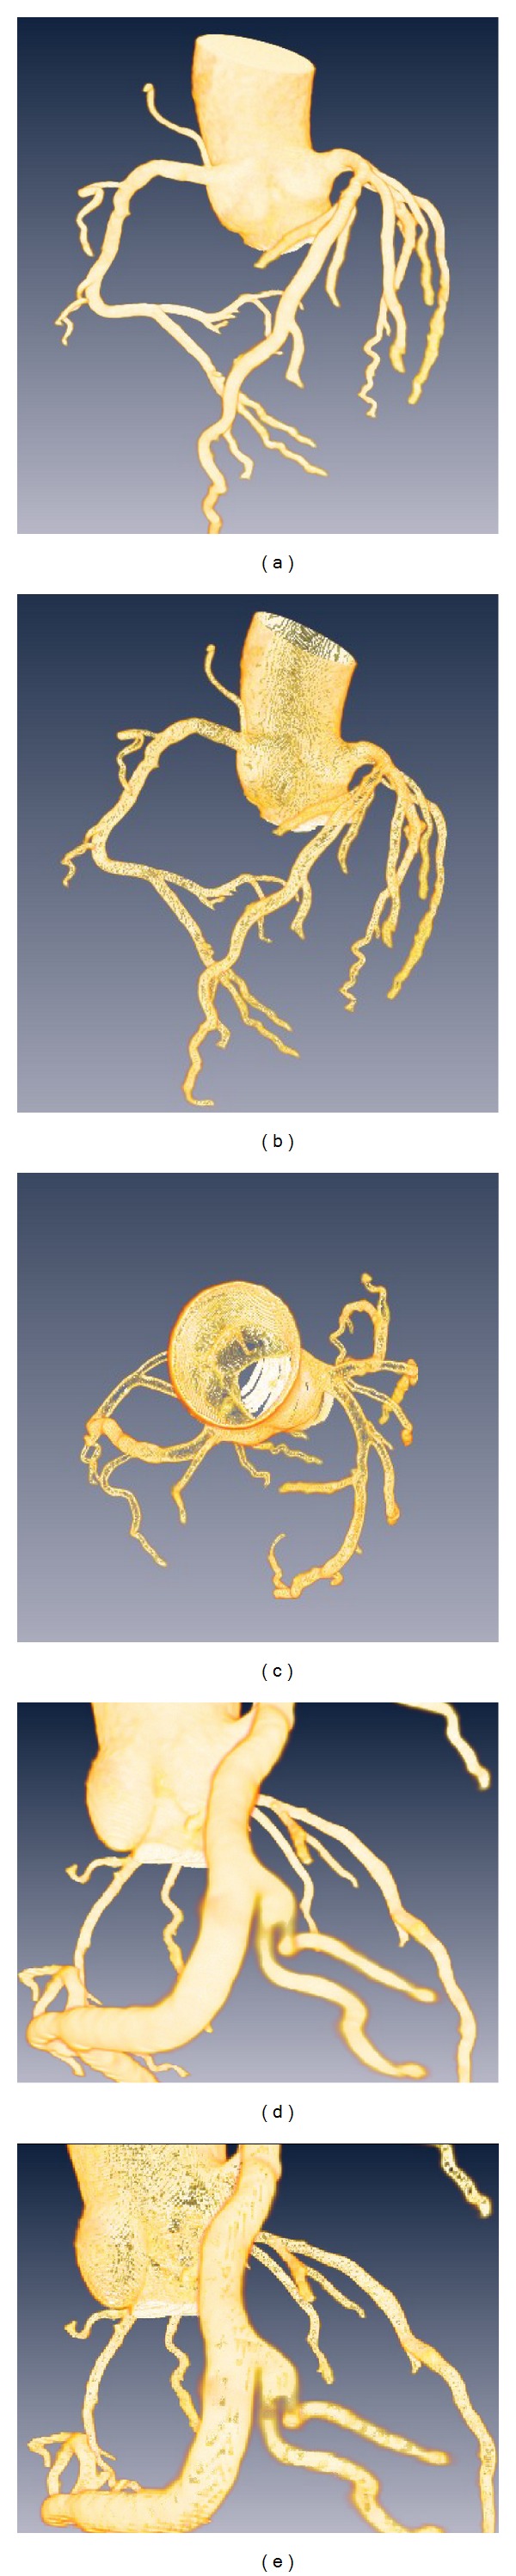
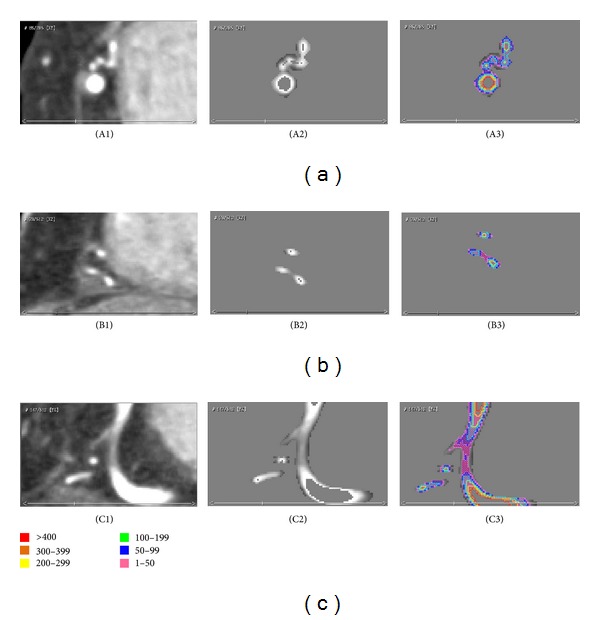
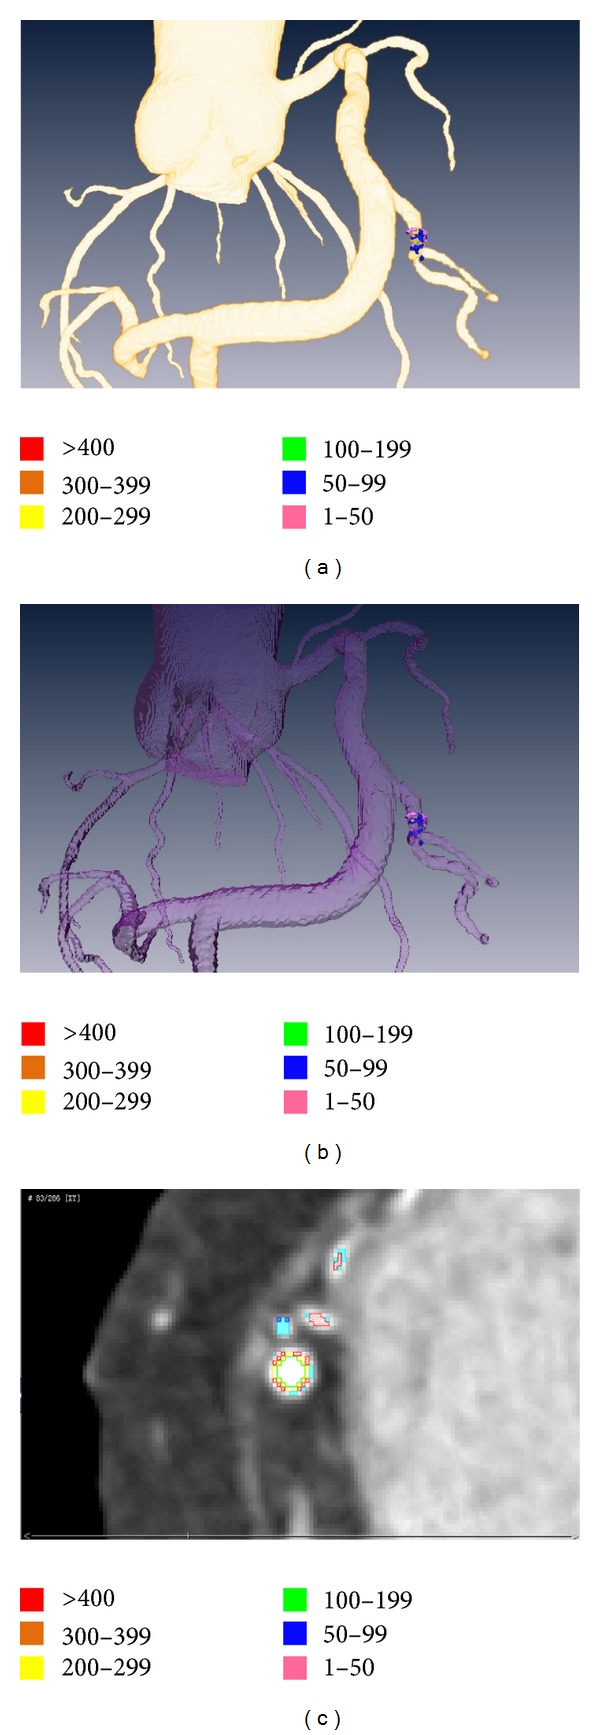
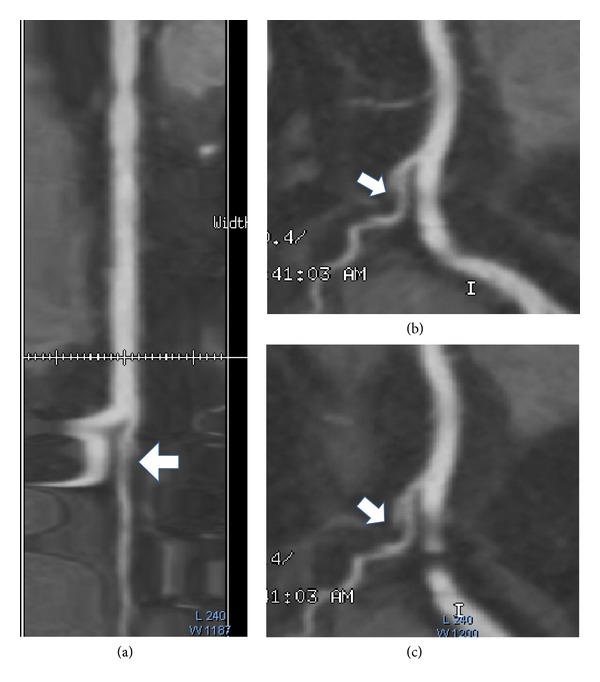
Noncalcified plaques (NCPs) are associated with the presence of lipid-core plaques that are prone to rupture. Thus, it is important to detect and monitor the development of NCPs. Contrast-enhanced coronary Computed Tomography Angiography (CTA) is a potential imaging technique to identify atherosclerotic plaques in the whole coronary tree, but it fails to provide information about vessel walls. In order to overcome the limitations of coronary CTA and provide more meaningful quantitative information for percutaneous coronary intervention (PCI), we proposed a Voxel-Map based on mathematical morphology to quantitatively analyze the noncalcified plaques on a three-dimensional coronary artery wall model (3D-CAWM). This approach is a combination of Voxel-Map analysis techniques, plaque locating, and anatomical location related labeling, which show more detailed and comprehensive coronary tree wall visualization.
Figures
Similar articles
-
Prospective validation of standardized, 3-dimensional, quantitative coronary computed tomographic plaque measurements using radiofrequency backscatter intravascular ultrasound as reference standard in intermediate coronary arterial lesions: results from the ATLANTA (assessment of tissue characteristics, lesion morphology, and hemodynamics by angiography with fractional flow reserve, intravascular ultrasound and virtual histology, and noninvasive computed tomography in atherosclerotic plaques) I study.JACC Cardiovasc Interv. 2011 Feb;4(2):198-208. doi: 10.1016/j.jcin.2010.10.008. JACC Cardiovasc Interv. 2011. PMID: 21349459
-
Automatic quantification and characterization of coronary atherosclerosis with computed tomography coronary angiography: cross-correlation with intravascular ultrasound virtual histology.Int J Cardiovasc Imaging. 2013 Jun;29(5):1177-90. doi: 10.1007/s10554-013-0194-x. Epub 2013 Feb 16. Int J Cardiovasc Imaging. 2013. PMID: 23417447
-
Reproducibility of noncalcified coronary artery plaque burden quantification from coronary CT angiography across different image analysis platforms.AJR Am J Roentgenol. 2014 Jan;202(1):W43-9. doi: 10.2214/AJR.13.11225. AJR Am J Roentgenol. 2014. PMID: 24370164
-
Histogram analysis of lipid-core plaques in coronary computed tomographic angiography: ex vivo validation against histology.Invest Radiol. 2013 Sep;48(9):646-53. doi: 10.1097/RLI.0b013e31828fdf9f. Invest Radiol. 2013. PMID: 23614976
-
Plaque assessment by coronary CT.Int J Cardiovasc Imaging. 2016 Jan;32(1):161-72. doi: 10.1007/s10554-015-0741-8. Epub 2015 Aug 18. Int J Cardiovasc Imaging. 2016. PMID: 26280890 Review.
References
-
- Voros S, Rinehart S, Qian Z, et al. Coronary atherosclerosis imaging by coronary CT angiography: current status, correlation with intravascular interrogation and meta-analysis. Journal of the American College of Cardiology. 2011;4(5):537–548. - PubMed
-
- Schlett CL, Ferencik M, Celeng C, et al. How to assess non-calcified plaque in CT angiography: delineation methods affect diagnostic accuracy of low-attenuation plaque by CT for lipid-core plaque in histology. European Heart Journal. 2013;14(11):1099–1105. - PubMed
-
- Motoyama S, Kondo T, Sarai M, et al. Multislice computed tomographic characteristics of coronary lesions in acute coronary syndromes. Journal of the American College of Cardiology. 2007;50(4):319–326. - PubMed
-
- Schuijf JD, Beck T, Burgstahler C, et al. Differences in plaque composition and distribution in stable coronary artery disease versus acute coronary syndromes; non-invasive evaluation with multi-slice computed tomography. Acute Cardiac Care. 2007;9(1):48–53. - PubMed
-
- Bourantas C, Garcia-Garcia H, Naka K, et al. Hybrid intravascular imaging: current applications and prospective potential in the study of coronary atherosclerosis. Journal of the American College of Cardiology. 2013;61(13):1369–1378. - PubMed
Publication types
MeSH terms
Substances
LinkOut - more resources
Full Text Sources
Other Literature Sources
Miscellaneous
