. 2013 Nov 19;8(11):e79843.
doi: 10.1371/journal.pone.0079843. eCollection 2013.

A p53 drug response signature identifies prognostic genes in high-risk neuroblastoma

Affiliations

A p53 drug response signature identifies prognostic genes in high-risk neuroblastoma

Eveline Barbieri et al. PLoS One. .

Abstract

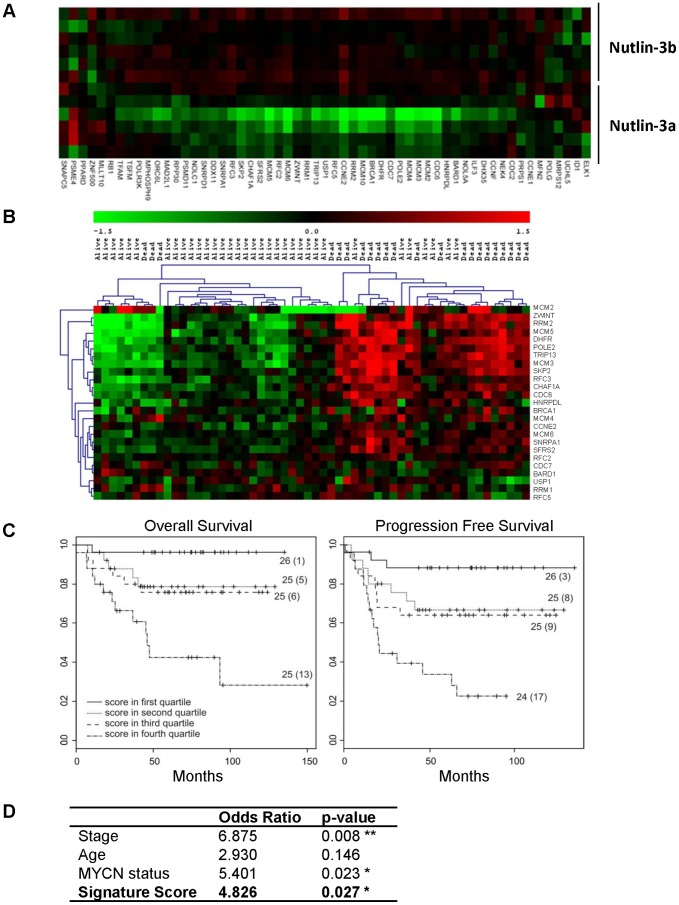
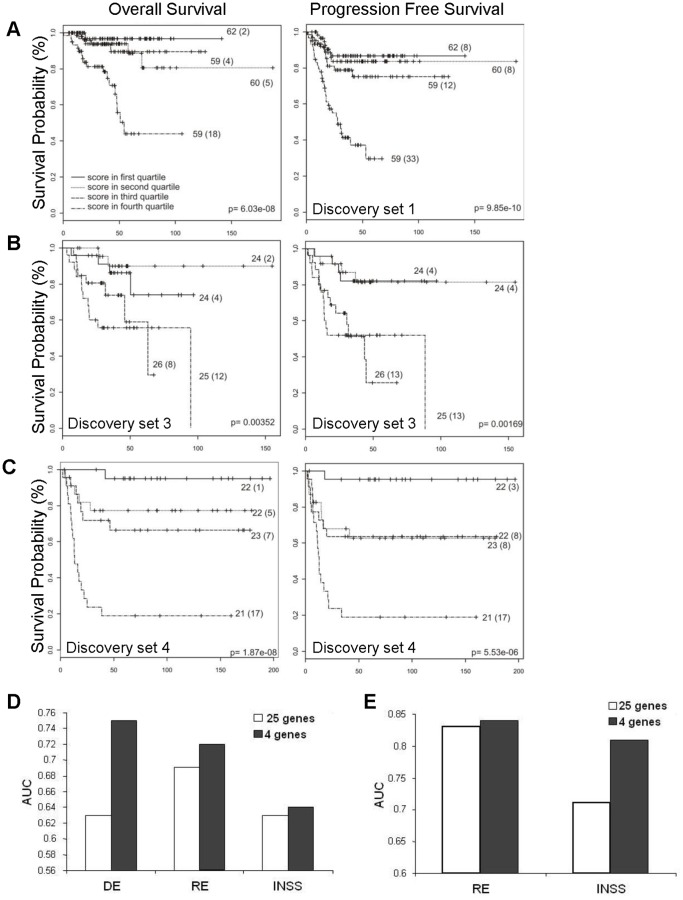
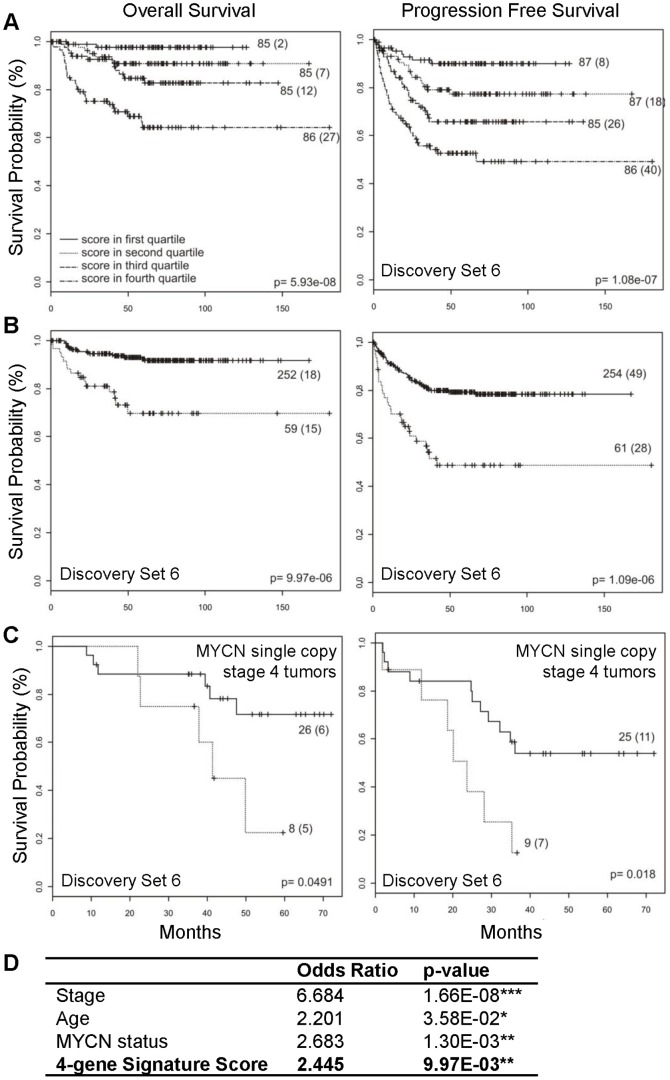
Chemotherapy induces apoptosis and tumor regression primarily through activation of p53-mediated transcription. Neuroblastoma is a p53 wild type malignancy at diagnosis and repression of p53 signaling plays an important role in its pathogenesis. Recently developed small molecule inhibitors of the MDM2-p53 interaction are able to overcome this repression and potently activate p53 dependent apoptosis in malignancies with intact p53 downstream signaling. We used the small molecule MDM2 inhibitor, Nutlin-3a, to determine the p53 drug response signature in neuroblastoma cells. In addition to p53 mediated apoptotic signatures, GSEA and pathway analysis identified a set of p53-repressed genes that were reciprocally over-expressed in neuroblastoma patients with the worst overall outcome in multiple clinical cohorts. Multifactorial regression analysis identified a subset of four genes (CHAF1A, RRM2, MCM3, and MCM6) whose expression together strongly predicted overall and event-free survival (p<0.0001). The expression of these four genes was then validated by quantitative PCR in a large independent clinical cohort. Our findings further support the concept that oncogene-driven transcriptional networks opposing p53 activation are essential for the aggressive behavior and poor response to therapy of high-risk neuroblastoma.


Conflict of interest statement

Competing Interests: The authors have declared that no competing interests exist.

Figures

Figure 1
Figure 1. MDM2 inhibition stabilizes p53 and induces apoptosis and p53 signaling pathways in neuroblastoma cells.
(A) Consistent with our previously data , Western blotting showed an increase in p53 levels within 4 hours exposure to Nutlin-3a in p202, p218, and IMR32 cells, confirming that the p53 signaling pathway is active in our system. (B) Apoptosis induction was tested in five established neuroblastoma lines (JF, IMR32), early passage neuroblastoma tumor cultures (p202, p218, H), and four non-neuroblastoma human solid tumors including colorectal (HCT116), breast (MCF7) and osteosarcoma (SJSA-1). SJSA-1 line differs by the level of MDM2 expression, being amplified 25 fold. A p53 mutant neuroblastoma line (SJ3-12), which lacks part of the DNA binding domain, was used as control. Proliferating cells were treated with Nutlin-3a for 24 hours and TdT-positive fraction was measured by flow cytometry. (C) Pathways enriched upon Nutlin-3a treatment: p53 signaling (GSEA ID: M6370), DNA damage (GSEA ID: M8378), and chemotherapy response (bleo_human_lymph) genes. Vertical columns separate Nutlin-3a versus Nutlin-3b at 3, 8, and 16 hours, horizontal rows indicate genes.
Figure 2
Figure 2. Correlation of p53 repressed genes and poor prognosis.
(A) Heat map of the gene set significantly down-regulated by Nutlin-3a but not Nutlin-3b. (B) Heat map with hierarchical clustering of the gene set with respect to neuroblastoma prognosis (discovery set 5). (C) Kaplan–Meier and log-rank analysis for progression-free (PFS) and overall (OS) survival of discovery set 2 based on 25 gene set: survival of 101 neuroblastoma patients in the 4 quartiles of the signature score. Numbers in parentheses refer to number of patients who experienced an event. (D) Multivariate logistic regression analysis: Odds Ratio and p-values are shown for disease stage (stage 4 vs. other), age (< or > 12 months), MYCN status (amplified vs. non-amplified), and the 25-gene signature score according to methods previously published .
Figure 3
Figure 3. The four-gene signature predict neuroblastoma outcome.
Kaplan–Meier and log-rank analysis for progression-free (PFS) and overall (OS) survival in discovery set 1 (A), set 3 (B), and set 4 (C) based on the four-gene signature score. (D, E) Comparison of signature performance between all 25 and the 4 selected genes. Results from discovery and validation study strategy. (D) Gene predictors made in discovery set 4 and predictions made in discovery set 1. (E) Gene predictors made in validation set 4 and predictions made in discovery set 5. X axis indicates clinical factors: death event (DE), relapse event (RE), and INSS stage; Y axis indicates Area Under Curve (AUC).
Figure 4
Figure 4. Independent validation of the four-gene signature in a large cohort of neuroblastoma patients (SIOPEN/GPOH).
(A) Kaplan–Meier and log-rank analysis for progression-free (PFS) and overall (OS) survival of the SIOPEN/GPOH cohort (discovery set 6): survival of 348 neuroblastoma patients in the 4 quartiles of the signature score. (B) Validation of the signature based on the four-gene PAM classifier. (C) Classification of the SIOPEN stage 4 tumors with MYCN single copy based on the four-gene PAM classifier. (D) Multivariate logistic regression analysis: Odds Ratio and p-values are shown for disease stage (stage 4 vs. other), age (<> 1y), MYCN status, and the four-gene signature score.
Figure 5
Figure 5. The four-gene signature is regulated by p53 activity.
Activation of p53 represses the four-gene signature. (A, B) Quantitative PCR demonstrates marked decrease of mRNA levels of the four genes after Nutlin-3a treatment (10 uM for 8 hours) in multiple p53 wild-type neuroblastoma lines (shown here LAN5 and IMR32). However, this effect is completely abrogated after p53 silencing or when the effect of Nutlin-3a is tested in a p53 mutant neuroblastoma cell line (LAN1) (C). Each error bar represents two biological replicates.

References

    1. Maris JM (2010) Recent advances in neuroblastoma. N Engl J Med 362: 2202–2211. - PMC - PubMed
    1. Speleman F, De Preter K, Vandesompele J (2011) Neuroblastoma genetics and phenotype: A tale of heterogeneity. Semin Cancer Biol. - PubMed
    1. Cohn SL, Pearson AD, London WB, Monclair T, Ambros PF, et al. (2009) The International Neuroblastoma Risk Group (INRG) classification system: an INRG Task Force report. J Clin Oncol 27: 289–297. - PMC - PubMed
    1. Janoueix-Lerosey I, Lequin D, Brugieres L, Ribeiro A, de Pontual L, et al. (2008) Somatic and germline activating mutations of the ALK kinase receptor in neuroblastoma. Nature 455: 967–970. - PubMed
    1. Molenaar JJ, Koster J, Zwijnenburg DA, van Sluis P, Valentijn LJ, et al. (2012) Sequencing of neuroblastoma identifies chromothripsis and defects in neuritogenesis genes. Nature 483: 589–593. - PubMed

Publication types

MeSH terms