. 2013 Dec 11;8(12):e79360.
doi: 10.1371/journal.pone.0079360. eCollection 2013.

Mortality attributable to influenza in England and Wales prior to, during and after the 2009 pandemic

Affiliations

Mortality attributable to influenza in England and Wales prior to, during and after the 2009 pandemic

Helen K Green et al. PLoS One. .

Abstract

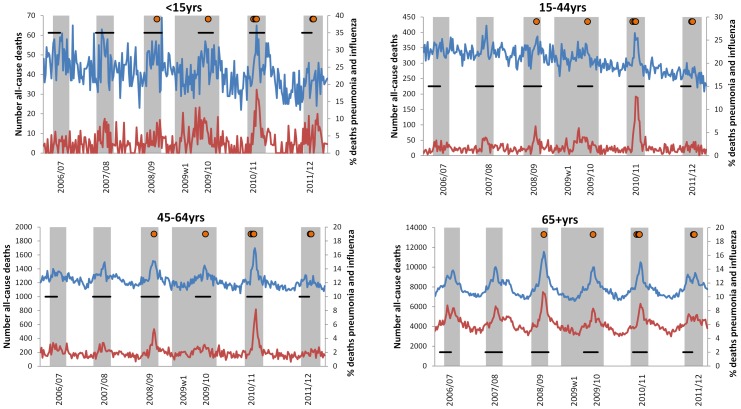
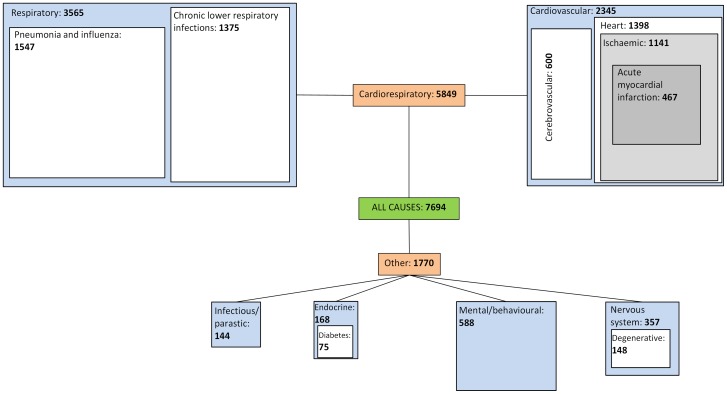
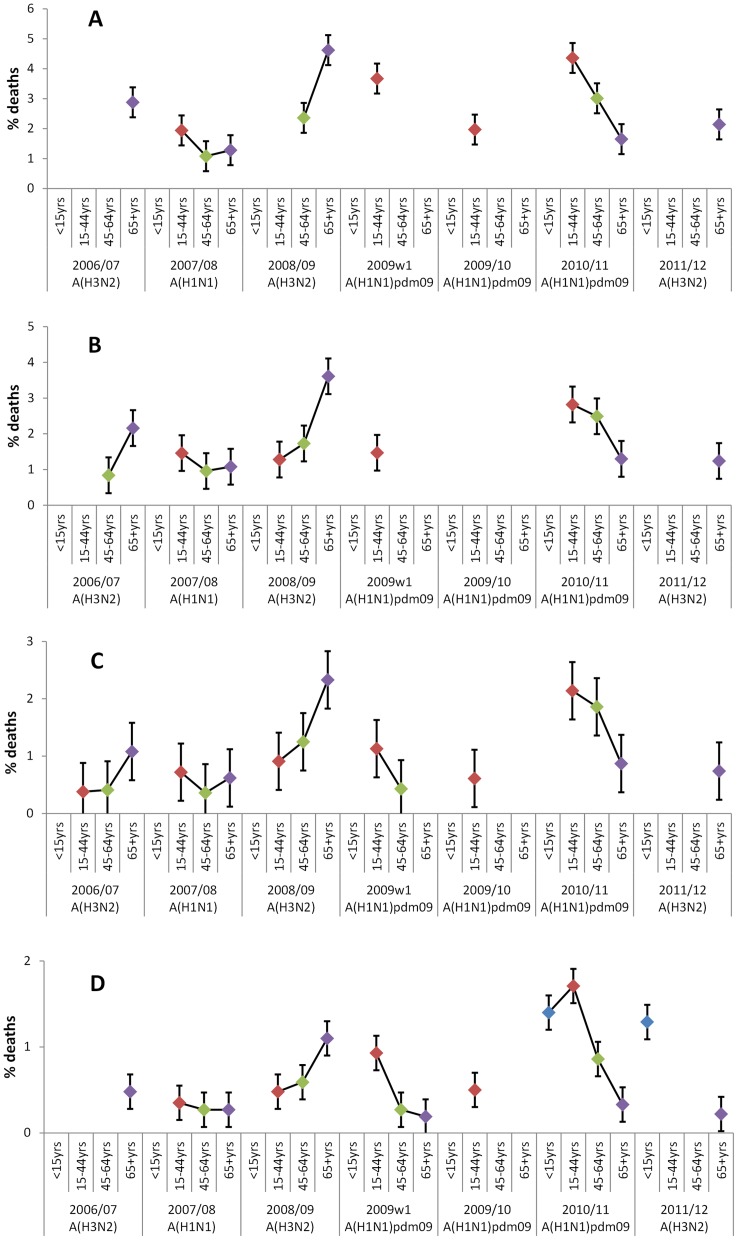
Very different influenza seasons have been observed from 2008/09-2011/12 in England and Wales, with the reported burden varying overall and by age group. The objective of this study was to estimate the impact of influenza on all-cause and cause-specific mortality during this period. Age-specific generalised linear regression models fitted with an identity link were developed, modelling weekly influenza activity through multiplying clinical influenza-like illness consultation rates with proportion of samples positive for influenza A or B. To adjust for confounding factors, a similar activity indicator was calculated for Respiratory Syncytial Virus. Extreme temperature and seasonal trend were controlled for. Following a severe influenza season in 2008/09 in 65+yr olds (estimated excess of 13,058 influenza A all-cause deaths), attributed all-cause mortality was not significant during the 2009 pandemic in this age group and comparatively low levels of influenza A mortality were seen in post-pandemic seasons. The age shift of the burden of seasonal influenza from the elderly to young adults during the pandemic continued into 2010/11; a comparatively larger impact was seen with the same circulating A(H1N1)pdm09 strain, with the burden of influenza A all-cause excess mortality in 15-64 yr olds the largest reported during 2008/09-2011/12 (436 deaths in 15-44 yr olds and 1,274 in 45-64 yr olds). On average, 76% of seasonal influenza A all-age attributable deaths had a cardiovascular or respiratory cause recorded (average of 5,849 influenza A deaths per season), with nearly a quarter reported for other causes (average of 1,770 influenza A deaths per season), highlighting the importance of all-cause as well as cause-specific estimates. No significant influenza B attributable mortality was detected by season, cause or age group. This analysis forms part of the preparatory work to establish a routine mortality monitoring system ahead of introduction of the UK universal childhood seasonal influenza vaccination programme in 2013/14.


Conflict of interest statement

Competing Interests: The authors have declared that no competing interests exist.

Figures

Figure 1
Figure 1. Weekly number of all-cause deaths by age group.
The weekly numbers of all-cause deaths are blue and the proportion of those deaths classified as pneumonia and influenza (ICD-10 J9-J18) are red. Weeks shaded grey correspond to significant influenza activity, defined as an influenza incidence proxy (influenza-like illness consultation rates multiplied by proportion of samples positive for influenza) greater than 0 for three consecutive weeks. Horizontal black lines correspond to weeks with significant RSV activity, defined as a RSV incidence proxy (acute bronchitis consultation rates multiplied by proportion of samples positive for RSV) greater than 0 for three consecutive weeks. Orange circles correspond to weeks in which mean CET was below 0°C.
Figure 2
Figure 2. Average influenza A attributable deaths by cause of death.
Blue boxes correspond to average all-age significant influenza A attributable deaths by ICD-10 chapter. White and grey boxes correspond to more specific causes of death within ICD-10 chapters and their average all-age significant influenza A attributable deaths. The sizes of the blue, white and grey boxes are proportional to the corresponding number of influenza A deaths attributed. Average values were derived from seasons in which significant influenza attribution was reported overall.
Figure 3
Figure 3. Proportion of all-cause deaths attributable to influenza A by age group and season when assessing coded causes of death.
Proportion of all-cause deaths attributable to influenza A by age group and season where significant (corresponding confidence intervals not crossing 0). The number of influenza A-attributable deaths correspond to the following datasets analysed: all-cause deaths (Figure 3a), cardiorespiratory deaths (Figure 3b), respiratory deaths (Figure 3c) and pneumonia and influenza deaths (Figure 3d). Dominant influenza A subtype by season is indicated.

References

    1. Health Protection Agency (2010) Epidemiological report of pandemic (H1N1)2009 in the UK. London: HPA. Available from: http://www.hpa.org.uk/webc/HPAwebFile/HPAweb_C/1284475321350. Accessed 2013 Oct 23.
    1. Simonsen L, Clarke MJ, Schonberger LB, Arden NH, Cox NJ, et al. (1998) Pandemic versus Epidemic Influenza Mortality: A Pattern of Changing Age Distribution. J Infect Dis 178(1): 53–60 10.1086/515616 - DOI - PubMed
    1. Viboud C, Miller M, Olson D, Osterholm M, Simonsen L (2010) Preliminary Estimates of Mortality and Years of Life Lost Associated with the 2009 A/H1N1 Pandemic in the US and Comparison with Past Influenza Seasons. PLoS Curr 2: RRN1153. - PMC - PubMed
    1. Wu P, Goldstein E, Ho LM, Yang L, Nishiura H, et al. (2012) Excess mortality associated with influenza A and B virus in Hong Kong, 1998–2009. J Infect Dis. 206(12): 1862–71 10.1093/infdis/jis628.Epub2012Oct8 - DOI - PMC - PubMed
    1. López-Cuadrado T, de Mateo S, Jiménez-Jorge S, Savulescu C, Larrauri A (2012) Influenza-related mortality in Spain, 1999–2005. Gac Sanit. 26(4): 325–9 10.1016/j.gaceta.2011.09.033.Epub2012Jan28 - DOI - PubMed

Publication types