

Dispersion estimation and its effect on test performance in RNA-seq data analysis: a simulation-based comparison of methods
- PMID: 24349066
- PMCID: PMC3857202
- DOI: 10.1371/journal.pone.0081415
Dispersion estimation and its effect on test performance in RNA-seq data analysis: a simulation-based comparison of methods
Abstract
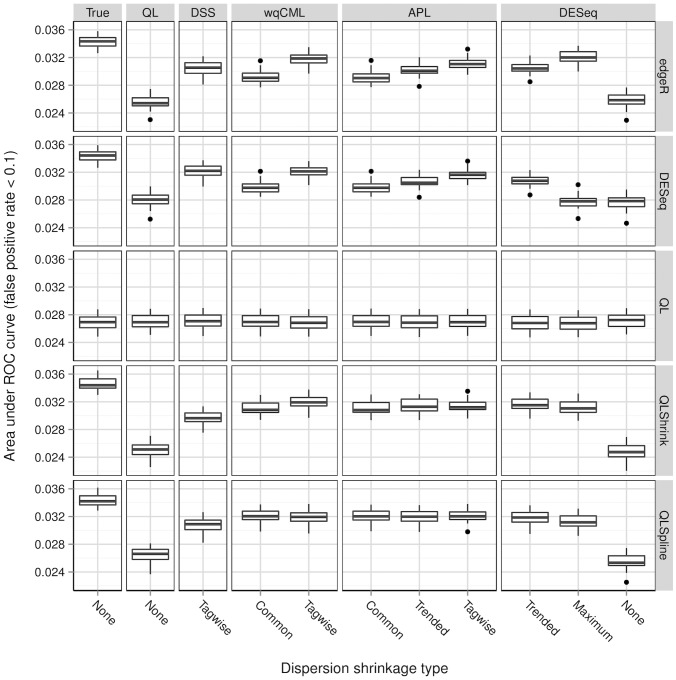
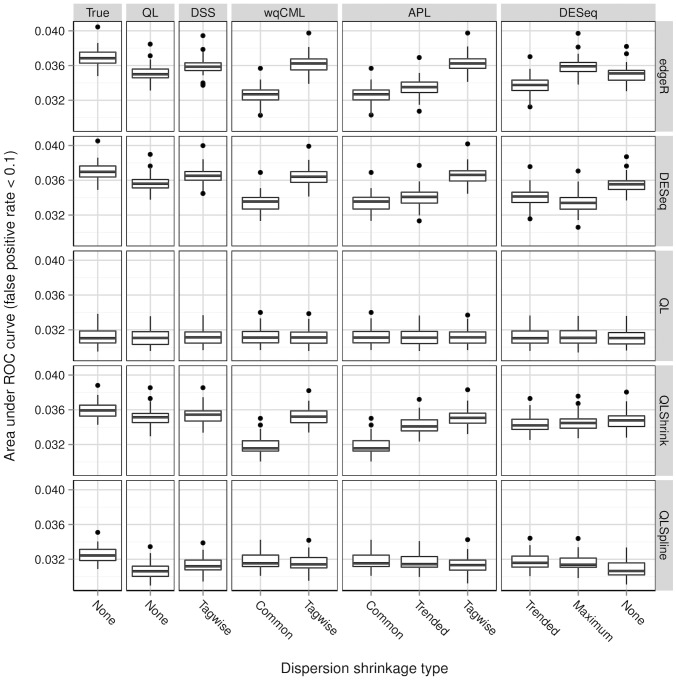
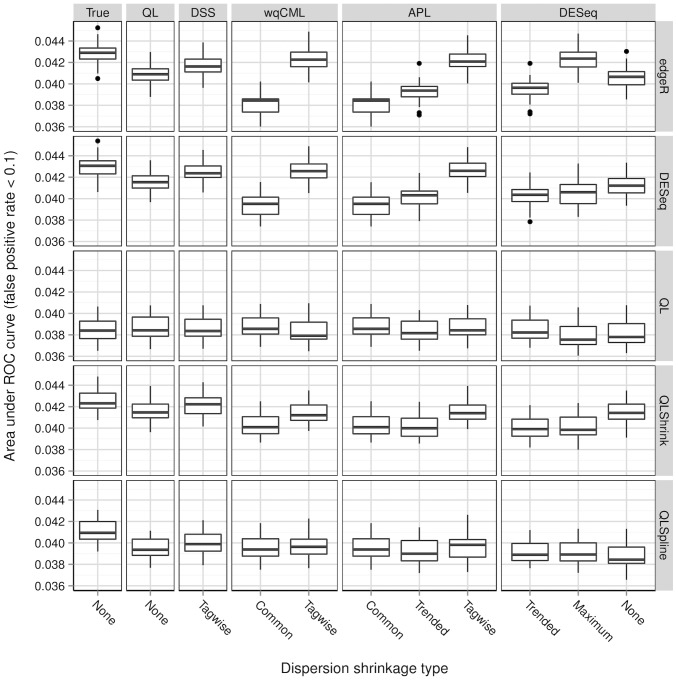
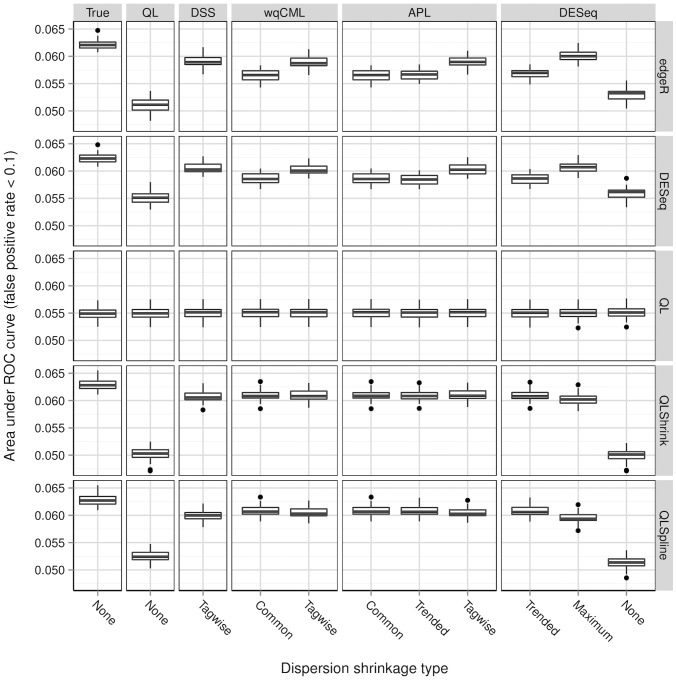
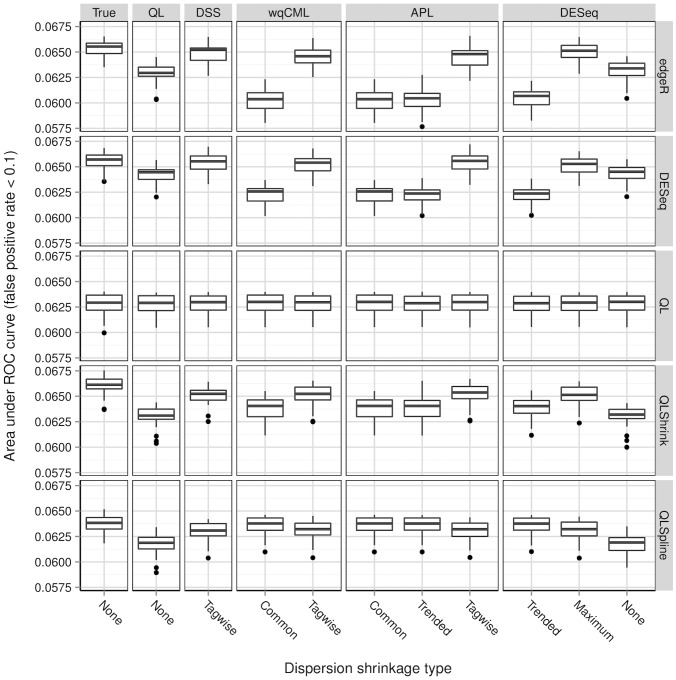
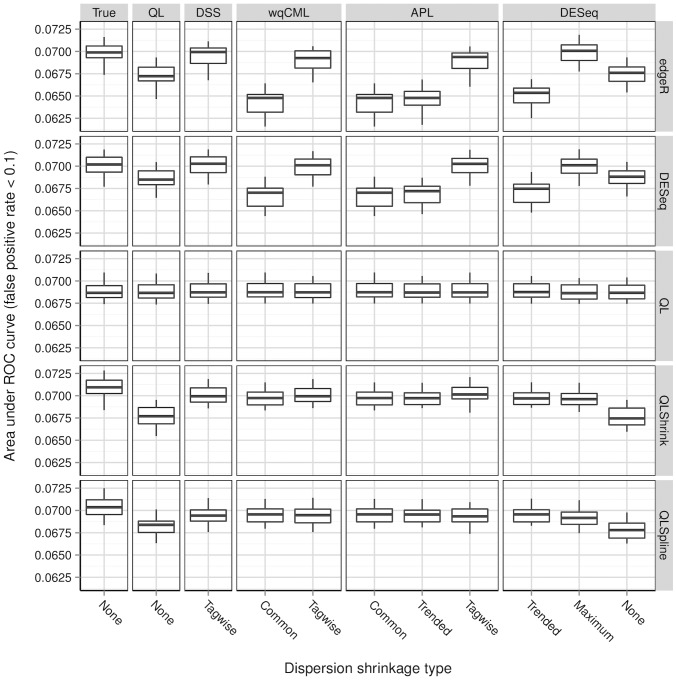
A central goal of RNA sequencing (RNA-seq) experiments is to detect differentially expressed genes. In the ubiquitous negative binomial model for RNA-seq data, each gene is given a dispersion parameter, and correctly estimating these dispersion parameters is vital to detecting differential expression. Since the dispersions control the variances of the gene counts, underestimation may lead to false discovery, while overestimation may lower the rate of true detection. After briefly reviewing several popular dispersion estimation methods, this article describes a simulation study that compares them in terms of point estimation and the effect on the performance of tests for differential expression. The methods that maximize the test performance are the ones that use a moderate degree of dispersion shrinkage: the DSS, Tagwise wqCML, and Tagwise APL. In practical RNA-seq data analysis, we recommend using one of these moderate-shrinkage methods with the QLShrink test in QuasiSeq R package.
Conflict of interest statement
Figures
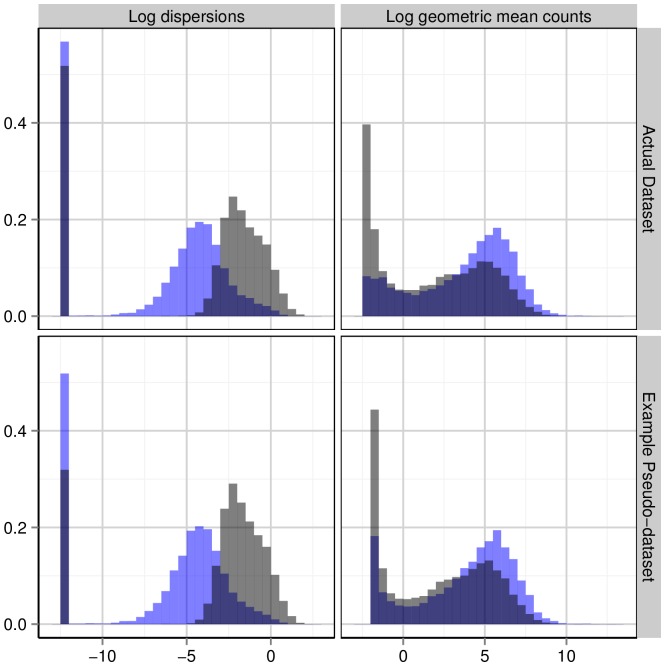
 ’s (log geometric mean counts from the real data) used in the simulations. The vertical bar at around
  in the plots of the log dispersions is an artifact of the QL method, which sets extremely low dispersions (i.e., dispersions of non-overdispersed genes) to a common minimum value.
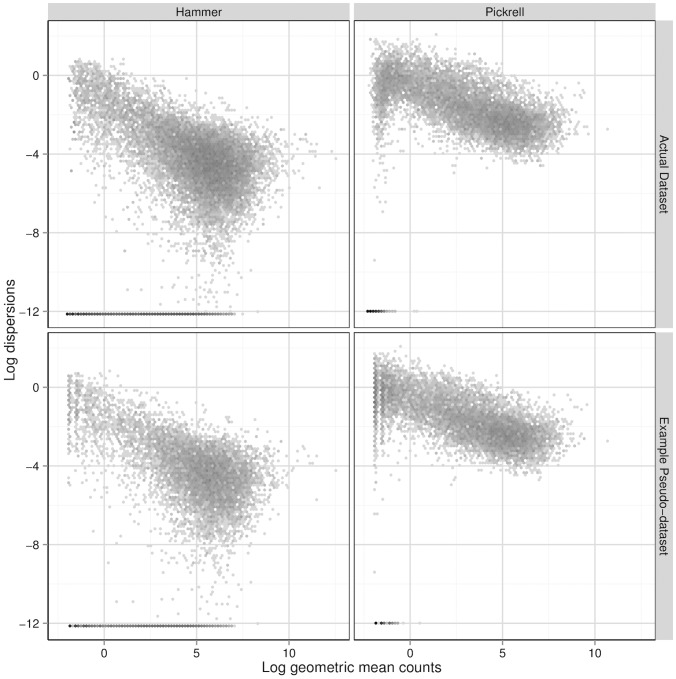
 ’s) and the gene-wise log geometric mean counts are the
  ’s used in the simulations. Bins in these two-dimensional histograms are shaded by their log frequency.
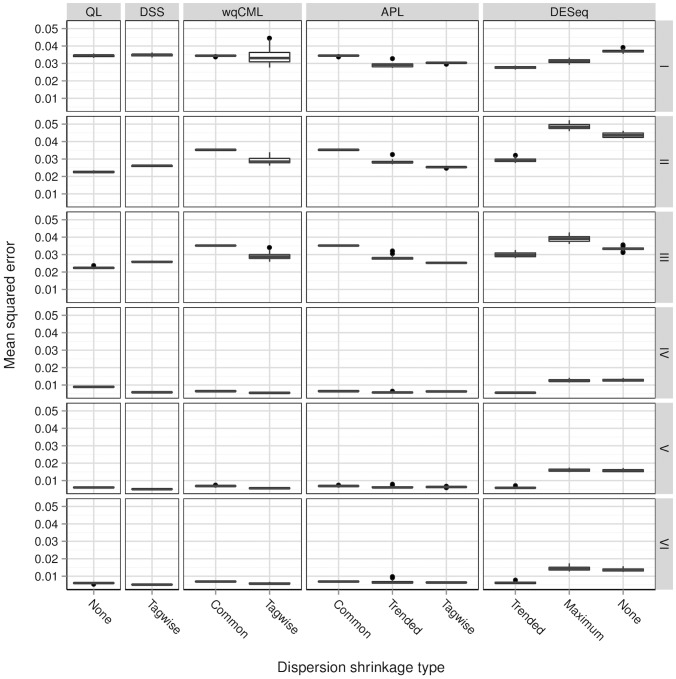
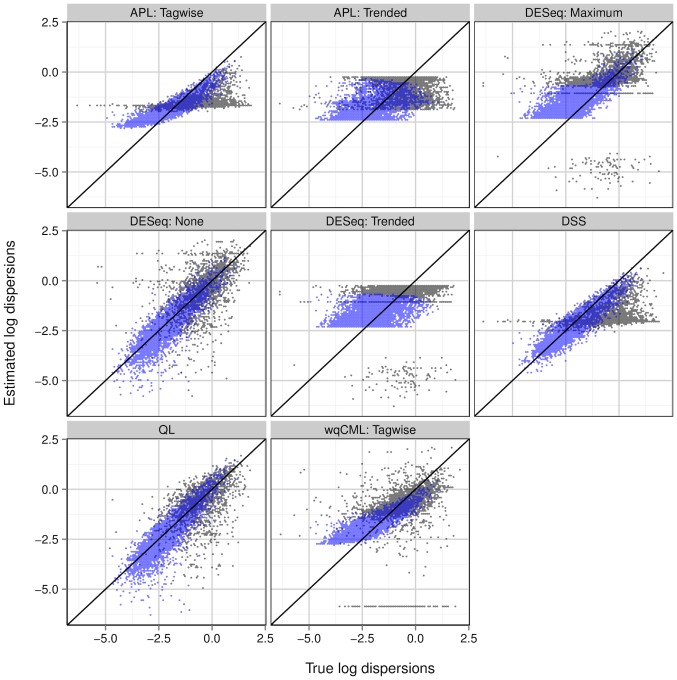
 2.17 to 1.63) are shown in black, while those above the median (log mean from 1.63 to 10.6) are shown in light blue. Overlapping points are shown in dark blue. Results for simulation settings I and III are similar.
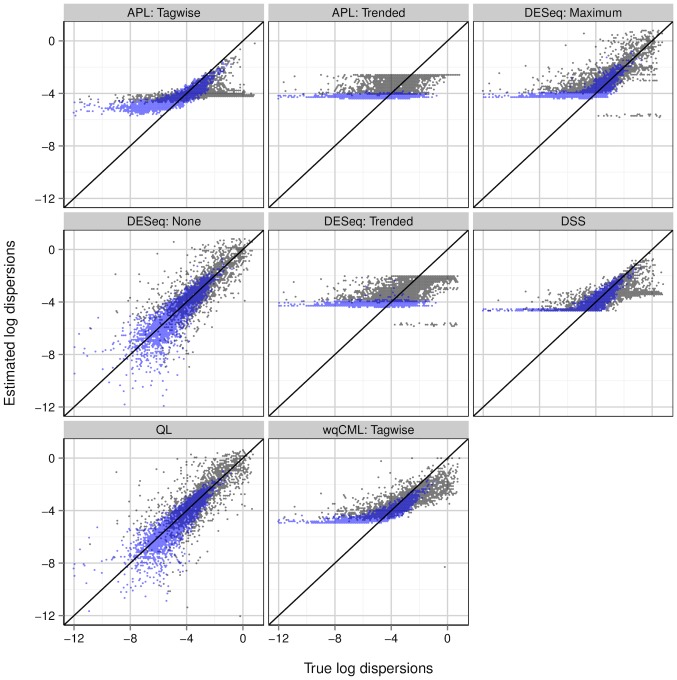
References
-
- Wang L, Li P, Brutnell TP (2010) Exploring plant transcriptomes using ultra high-throughput sequencing. Briefings in Functional Genomics 9: 118–128. - PubMed
-
- Cameron AC, Trivedi PK (1998) Regression Analysis of Count Data. Cambridge University Press.
-
- Si Y, Liu P (2012) An optimal test with maximum average power while controlling fdr with application to rna-seq data. Biometrics 69: 594–605. - PubMed
Publication types
MeSH terms
LinkOut - more resources
Full Text Sources
Other Literature Sources
