. 2013 Dec 11;8(12):e81449.
doi: 10.1371/journal.pone.0081449. eCollection 2013.

Hierarchical self-organization of non-cooperating individuals

Affiliations

Hierarchical self-organization of non-cooperating individuals

Tamás Nepusz et al. PLoS One. .

Abstract

Hierarchy is one of the most conspicuous features of numerous natural, technological and social systems. The underlying structures are typically complex and their most relevant organizational principle is the ordering of the ties among the units they are made of according to a network displaying hierarchical features. In spite of the abundant presence of hierarchy no quantitative theoretical interpretation of the origins of a multi-level, knowledge-based social network exists. Here we introduce an approach which is capable of reproducing the emergence of a multi-levelled network structure based on the plausible assumption that the individuals (representing the nodes of the network) can make the right estimate about the state of their changing environment to a varying degree. Our model accounts for a fundamental feature of knowledge-based organizations: the less capable individuals tend to follow those who are better at solving the problems they all face. We find that relatively simple rules lead to hierarchical self-organization and the specific structures we obtain possess the two, perhaps most important features of complex systems: a simultaneous presence of adaptability and stability. In addition, the performance (success score) of the emerging networks is significantly higher than the average expected score of the individuals without letting them copy the decisions of the others. The results of our calculations are in agreement with a related experiment and can be useful from the point of designing the optimal conditions for constructing a given complex social structure as well as understanding the hierarchical organization of such biological structures of major importance as the regulatory pathways or the dynamics of neural networks.


Conflict of interest statement

Competing Interests: The authors have declared that no competing interests exist.

Figures

Figure 1
Figure 1. Schematic explanation of the main stages of a single step in our model.
The environment is assumed to have two states: green and red. Nodes of the graph represent the individuals in the model and they are coloured according to their response in the last round (green or red). In the nomination phase, an edge from node A to node B means that A intends to seek advice from B. In the acceptance phase, the directions of the edges are reversed: a black edge from A to B with a tick mark means that A will advise B; a gray edge with a cross means that A refused to advise B in this round. In the propagation phase, edges represent the direction of information propagation and their colour is equal to the last response (i.e. colour) of the source node. The rightmost panel describes how the new responses of the individuals are derived from their own judgment and the information they received from others.
Figure 2
Figure 2. Behaviour and performance of our model as a function of time and noise for various ability distributions.
The columns correspond to constant, normal, log-normal and power-law ability distributions with a mean ability of 0.25 and a variance of 1/48. The upper row corresponds to the case of no noise; the middle row corresponds to 20% relative noise. The green and blue lines correspond to two hierarchy measures (fraction of forward arcs and global reaching centrality, expressed as numbers between 0 (no hierarchy) to 1 (maximal hierarchy that is theoretically possible). Red lines indicate the improvement of the overall performance of the individuals, expressed as percentages on the right axis. The heat maps in the bottom line represent the improvement as a function of time and relative noise level; note that the log-normal and power-law distributions are more tolerant to noise than the normal ability distribution (for more detailed definitions of the above quantities see the Methods). Each data point is averaged from 500 trials with N = 256 individuals; error bars represent the standard error of the mean but they are smaller than the corresponding markers on the plot. A smaller scale run of the model is visualized by Video S1.
Figure 3
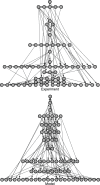
Figure 3. Qualitative comparison of the experimental and the modelling results.
The bottom network was generated by our approach showing features similar to those obtained during the Liskaland experiment. The data were plotted using the method introduced in Ref. 26.
Figure 4
Figure 4. The effect of transient noise on the structure of the model and the ability matrix.
t = 0 represents a starting configuration where the improvement has already converged to a stationary level in the absence of noise. A relative noise of 40% was added to the model between t = 500 and t = 3500. The panels on the right show a 16×16 sub-matrix of the ability matrix at t = 500 (i.e. before the noise was turned on) and at t = 4000 (i.e. after the noise was turned off). Note how the performance improvement increased at t>3500 compared to the baseline level between t = 0 and t = 500, and that the estimates in the ability matrix became more diverse since the agents were forced to experiment with the structure of the communication graph due to the high level of noise. A small-scale simulation of the above kind is visualized by Video S2.

References

    1. Salthe SN (1985) Evolving Hierarchical Structures. New York: Columbia University Press. 343 p.
    1. Sethi SP, Zhang Q (1994) Hierarchical Decision Making in StochasticManufacturing Systems. Boston: Birkhäuser. 422 p.
    1. Pumain D, editor (2006) Hierarchy in Natural and Social Sciences. Dodrecht: Springer. 244 p.
    1. Lane D (2006) Hierarchy, Complexity, Society. In: Pumain D, editor. Hierarchy in Natural and Social Sciences, Methodos Series Volume 3. Dodrecht: Springer. 81–119.
    1. Dubreuil B (2010) Human Evolution and the Origins of Hierarchies: The State of Nature. Cambridge: Cambridge University Press. 288 p.

Publication types

LinkOut - more resources