. 2013 Dec 11;8(12):e81499.
doi: 10.1371/journal.pone.0081499. eCollection 2013.

Choriocapillaris and choroidal microvasculature imaging with ultrahigh speed OCT angiography

Affiliations

Choriocapillaris and choroidal microvasculature imaging with ultrahigh speed OCT angiography

WooJhon Choi et al. PLoS One. .

Abstract

We demonstrate in vivo choriocapillaris and choroidal microvasculature imaging in normal human subjects using optical coherence tomography (OCT). An ultrahigh speed swept source OCT prototype at 1060 nm wavelengths with a 400 kHz A-scan rate is developed for three-dimensional ultrahigh speed imaging of the posterior eye. OCT angiography is used to image three-dimensional vascular structure without the need for exogenous fluorophores by detecting erythrocyte motion contrast between OCT intensity cross-sectional images acquired rapidly and repeatedly from the same location on the retina. En face OCT angiograms of the choriocapillaris and choroidal vasculature are visualized by acquiring cross-sectional OCT angiograms volumetrically via raster scanning and segmenting the three-dimensional angiographic data at multiple depths below the retinal pigment epithelium (RPE). Fine microvasculature of the choriocapillaris, as well as tightly packed networks of feeding arterioles and draining venules, can be visualized at different en face depths. Panoramic ultra-wide field stitched OCT angiograms of the choriocapillaris spanning ∼32 mm on the retina show distinct vascular structures at different fundus locations. Isolated smaller fields at the central fovea and ∼6 mm nasal to the fovea at the depths of the choriocapillaris and Sattler's layer show vasculature structures consistent with established architectural morphology from histological and electron micrograph corrosion casting studies. Choriocapillaris imaging was performed in eight healthy volunteers with OCT angiograms successfully acquired from all subjects. These results demonstrate the feasibility of ultrahigh speed OCT for in vivo dye-free choriocapillaris and choroidal vasculature imaging, in addition to conventional structural imaging.


Conflict of interest statement

Competing Interests: The authors have the following interests: WJC: none; KJM: none; BP: Employment at Thorlabs Inc; CDL: none; JJL: none; VJ: Personal financial interest, intellectual property, and employment at Praevium Research Inc.; AEC: Personal financial interest, intellectual property, and employment at Thorlabs Inc; JSD: research support from Carl Zeiss Meditec Inc. and Optovue Inc., and stock in Hemera Biosciences Inc., EyeNetra, and Ophthotech Corp; RH: royalties from intellectual property owned by Massachusetts Institute of Technology and licensed to Optovue Inc.; JGF: royalties from intellectual property owned by Massachusetts Institute of Technology and licensed to Carl Zeiss Meditec Inc. and Optovue Inc., and stock options with Optovue Inc. The following authors also have patents and applications: JGH and RF, US Patent Application 2011/0134394 - Methods and apparatus for optical coherence tomography scanning; US Patent 7,884,945 - Methods and apparatus for optical coherence tomography scanning; US Patent 8,405,834 - Methods and apparatus for optical coherence tomography scanning. VJ, US patent 7,468,997 - System for swept source optical coherence tomography; US patent application 13/952,554 - Widely tunable short cavity laser; and US provisional application 61/793,730 - Widely tunable swept source. This does not alter the authors' adherence to all the PLOS ONE policies on sharing data and materials.

Figures

Figure 1
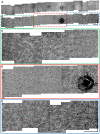
Figure 1. Generating OCT angiography data from OCT intensity data.
(A) Multiple OCT intensity B-scans are acquired from the same location on the retina and compared with each other pixel-by-pixel to detect motion contrast. The resultant OCT cross-sectional angiogram is segmented with respect to the RPE using one of the corresponding intensity images. (B) By performing the steps in (A) volumetrically and displaying the OCT angiography data in an en face plane below the RPE, the choriocapillaris microvasculature can be visualized. Yellow arrows indicate shadowing artifact from thick retinal vessels.
Figure 2
Figure 2. Panoramic wide field of view OCT angiogram of the choriocapillaris spanning ∼32 mm on the retina.
(A) Stitched OCT intensity en face projection images. (B) Stitched OCT angiograms of the choriocapillaris. Different microvasculature patterns and densities can be observed at different fundus locations. (C–E) Close-up views of the OCT angiograms of the choriocapillaris in (B) for better visualization. Scale bars: 1.5 mm.
Figure 3
Figure 3. 1.5×1.5 mm en face OCT angiograms at three different fundus locations.
(A,D,G) OCT angiogram of the choriocapillaris, OCT angiogram of the Sattler's layer, and en face OCT intensity image (slice) corresponding to the choriocapillaris layer, respectively, at the central fovea. (B,E,H) OCT angiogram of the choriocapillaris, OCT angiogram of the Sattler's layer, and en face OCT intensity image (slice) corresponding to the choriocapillaris layer, respectively, at ∼6 mm temporal to the central fovea. The arrowhead indicates venules and arrow arteriole in (E). (C,F,I) OCT angiogram of the choriocapillaris, OCT angiogram of the Sattler's layer, and en face OCT intensity image (slice) corresponding to the choriocapillaris layer, respectively, at ∼12 mm nasal to the central fovea. (J,K) Electron micrographs of corrosion casts reproduced from Olver et al. with permission. Scale bars: 250 µm.
Figure 4
Figure 4. Three-dimensional rendering of a volumetric angiography data set covering a 1.5 mm×1.5 mm field on the retina.
The locations where feeding arterioles and draining venules branch out to the choriocapillaris can be visualized more easily in three-dimensional rendering. One side of the rendering shows only depths below the choriocapillaris to emphasize the depth-resolving capability of OCT angiography.
Figure 5
Figure 5. 1.5×1.5 mm en face OCT angiograms at the central fovea for eight normal subjects.
The choriocapillaris can be visualized in all subjects. Some variation between individuals can be noticed. The angiogram in (A) is the same image as in Figure 3(A) but in grayscale. Scale bars: 250 µm.
Figure 6
Figure 6. 1.5×1.5 mm en face OCT angiograms at ∼6 mm temporal to the fovea for eight normal subjects.
The choriocapillaris can be visualized in all subjects. Some variation between individuals can be noticed. The angiogram in (A) is the same image as in Figure 3(B) but in grayscale. The order of the subjects is the same as in Figure 5. Scale bars: 250 µm.

Similar articles

Cited by

References

    1. Schmetterer L, Kiel JW (2012) Ocular Blood Flow. Springer Berlin Heidelberg.
    1. Lutty G, Grunwald J, Majji AB, Uyama M, Yoneya S (1999) Changes in choriocapillaris and retinal pigment epithelium in age-related macular degeneration. Mol Vis 5: 35. - PubMed
    1. Cao J, McLeod S, Merges CA, Lutty GA (1998) Choriocapillaris degeneration and related pathologic changes in human diabetic eyes. Arch Ophthalmol 116: 589–597. - PubMed
    1. von Sallmann L (1961) The structure of the eye. Arch Ophthalmol 66: 920–921.
    1. Sarks JP, Sarks SH, Killingsworth MC (1988) Evolution of Geographic Atrophy of the Retinal-Pigment Epithelium. Eye 2: 552–577. - PubMed

Publication types