

Mechanistic phenotypes: an aggregative phenotyping strategy to identify disease mechanisms using GWAS data
- PMID: 24349080
- PMCID: PMC3861317
- DOI: 10.1371/journal.pone.0081503
Mechanistic phenotypes: an aggregative phenotyping strategy to identify disease mechanisms using GWAS data
Abstract
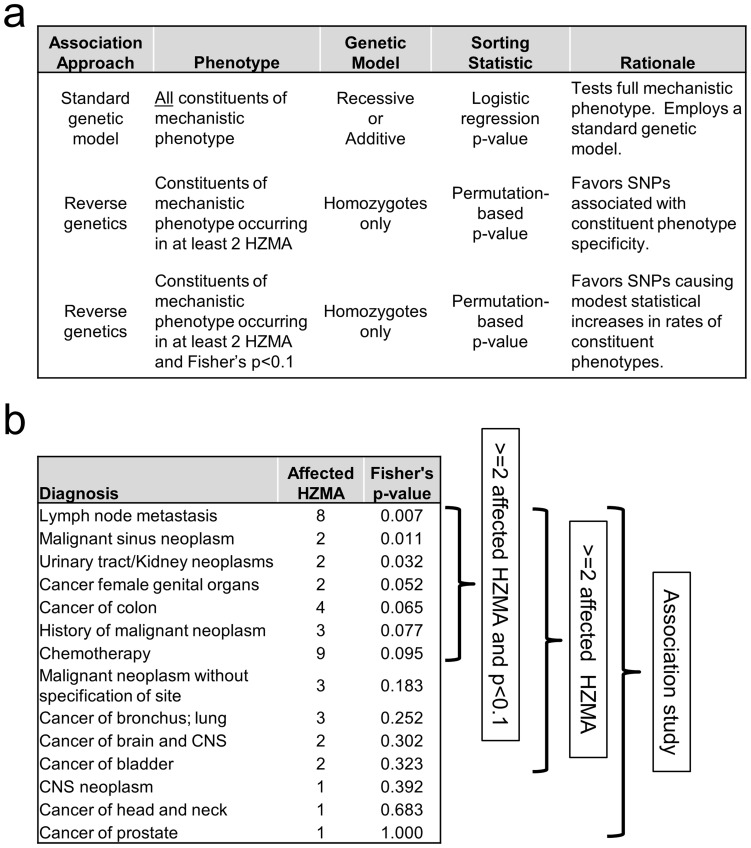
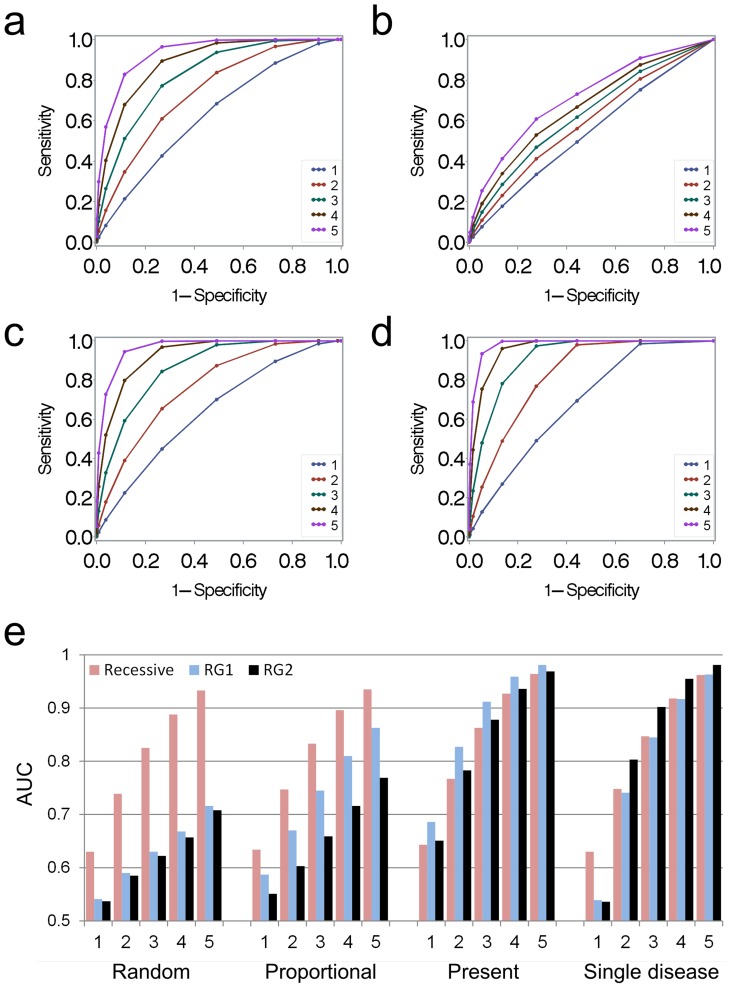
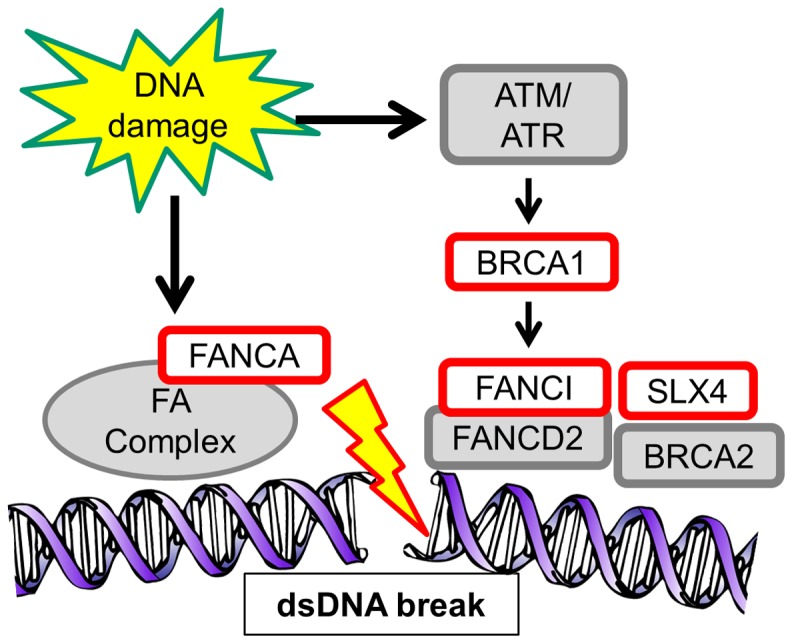
A single mutation can alter cellular and global homeostatic mechanisms and give rise to multiple clinical diseases. We hypothesized that these disease mechanisms could be identified using low minor allele frequency (MAF<0.1) non-synonymous SNPs (nsSNPs) associated with "mechanistic phenotypes", comprised of collections of related diagnoses. We studied two mechanistic phenotypes: (1) thrombosis, evaluated in a population of 1,655 African Americans; and (2) four groupings of cancer diagnoses, evaluated in 3,009 white European Americans. We tested associations between nsSNPs represented on GWAS platforms and mechanistic phenotypes ascertained from electronic medical records (EMRs), and sought enrichment in functional ontologies across the top-ranked associations. We used a two-step analytic approach whereby nsSNPs were first sorted by the strength of their association with a phenotype. We tested associations using two reverse genetic models and standard additive and recessive models. In the second step, we employed a hypothesis-free ontological enrichment analysis using the sorted nsSNPs to identify functional mechanisms underlying the diagnoses comprising the mechanistic phenotypes. The thrombosis phenotype was solely associated with ontologies related to blood coagulation (Fisher's p = 0.0001, FDR p = 0.03), driven by the F5, P2RY12 and F2RL2 genes. For the cancer phenotypes, the reverse genetics models were enriched in DNA repair functions (p = 2×10⁻⁵, FDR p = 0.03) (POLG/FANCI, SLX4/FANCP, XRCC1, BRCA1, FANCA, CHD1L) while the additive model showed enrichment related to chromatid segregation (p = 4×10⁻⁶, FDR p = 0.005) (KIF25, PINX1). We were able to replicate nsSNP associations for POLG/FANCI, BRCA1, FANCA and CHD1L in independent data sets. Mechanism-oriented phenotyping using collections of EMR-derived diagnoses can elucidate fundamental disease mechanisms.
Conflict of interest statement
Figures
References
Publication types
MeSH terms
Grants and funding
- UL1 TR000445/TR/NCATS NIH HHS/United States
- U01 HG006375/HG/NHGRI NIH HHS/United States
- U01 HG006382/HG/NHGRI NIH HHS/United States
- U01 HG004603/HG/NHGRI NIH HHS/United States
- R01 DK088231/DK/NIDDK NIH HHS/United States
- P30 DK072488/DK/NIDDK NIH HHS/United States
- UO1HG006375/HG/NHGRI NIH HHS/United States
- RC2 GM092618/GM/NIGMS NIH HHS/United States
- R01DK088231/DK/NIDDK NIH HHS/United States
- U01 HG006378/HG/NHGRI NIH HHS/United States
- U01-HG004609/HG/NHGRI NIH HHS/United States
- U01-HG-04603/HG/NHGRI NIH HHS/United States
- T32 GM007569/GM/NIGMS NIH HHS/United States
- R01 LM010685/LM/NLM NIH HHS/United States
- U01HG006382/HG/NHGRI NIH HHS/United States
- T32 GM07569/GM/NIGMS NIH HHS/United States
- R01 LM 010685/LM/NLM NIH HHS/United States
- U01 HG004609/HG/NHGRI NIH HHS/United States
- U01 HG006389/HG/NHGRI NIH HHS/United States
- 1U02HG004608-01/HG/NHGRI NIH HHS/United States
- U01-HG04599/HG/NHGRI NIH HHS/United States
- U01 HG004599/HG/NHGRI NIH HHS/United States
- 16FTF30130005/AHA/American Heart Association-American Stroke Association/United States
- P30DK072488/DK/NIDDK NIH HHS/United States
- U01 HG004608/HG/NHGRI NIH HHS/United States
- R01 DK091601/DK/NIDDK NIH HHS/United States
- 5U01HG006389-02/HG/NHGRI NIH HHS/United States
- R01DK091601/DK/NIDDK NIH HHS/United States
LinkOut - more resources
Full Text Sources
Other Literature Sources
Miscellaneous
