

A prognostic gene signature for metastasis-free survival of triple negative breast cancer patients
- PMID: 24349199
- PMCID: PMC3859562
- DOI: 10.1371/journal.pone.0082125
A prognostic gene signature for metastasis-free survival of triple negative breast cancer patients
Abstract
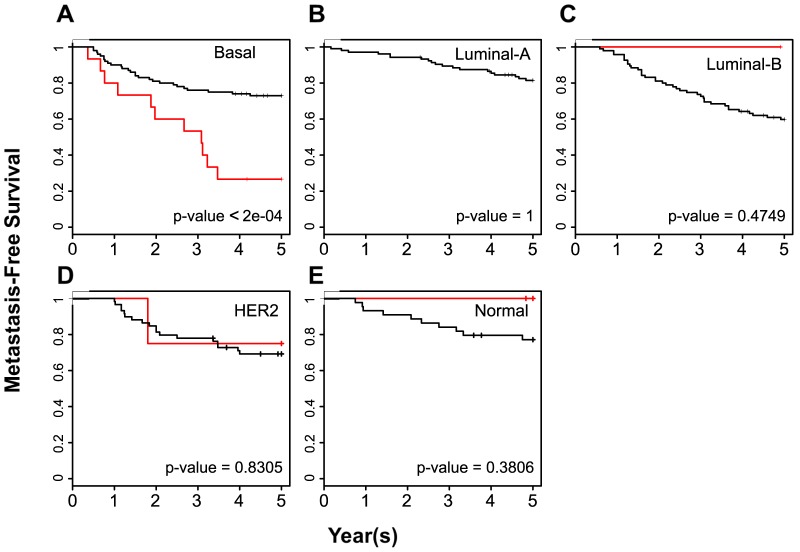
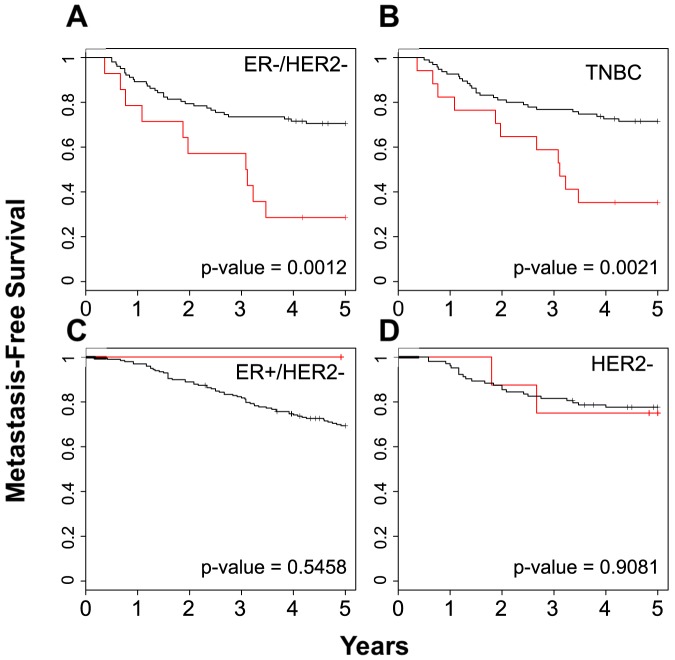
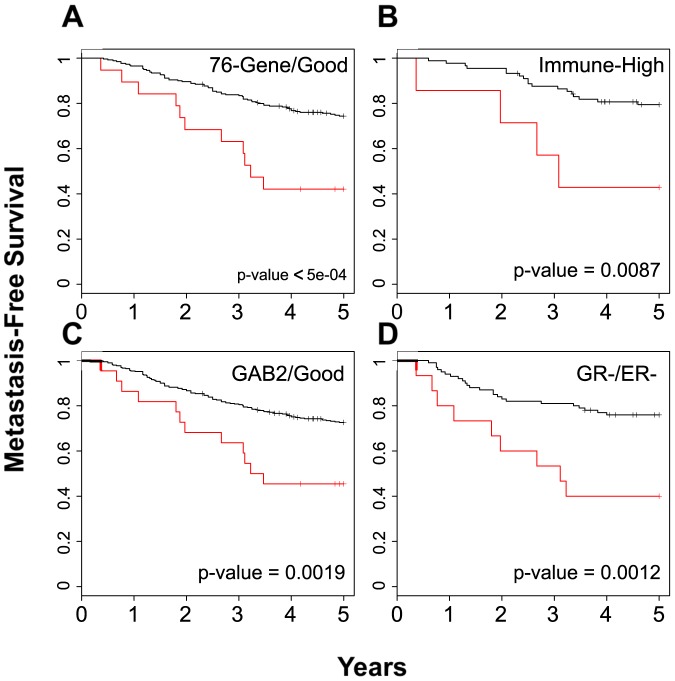
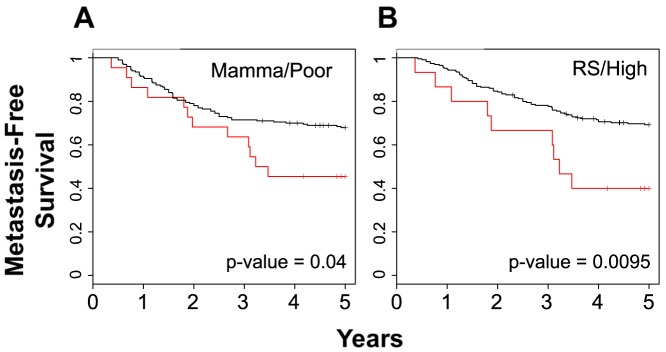
Although triple negative breast cancers (TNBC) are the most aggressive subtype of breast cancer, they currently lack targeted therapies. Because this classification still includes a heterogeneous collection of tumors, new tools to classify TNBCs are urgently required in order to improve our prognostic capability for high risk patients and predict response to therapy. We previously defined a gene expression signature, RKIP Pathway Metastasis Signature (RPMS), based upon a metastasis-suppressive signaling pathway initiated by Raf Kinase Inhibitory Protein (RKIP). We have now generated a new BACH1 Pathway Metastasis gene signature (BPMS) that utilizes targets of the metastasis regulator BACH1. Specifically, we substituted experimentally validated target genes to generate a new BACH1 metagene, developed an approach to optimize patient tumor stratification, and reduced the number of signature genes to 30. The BPMS significantly and selectively stratified metastasis-free survival in basal-like and, in particular, TNBC patients. In addition, the BPMS further stratified patients identified as having a good or poor prognosis by other signatures including the Mammaprint® and Oncotype® clinical tests. The BPMS is thus complementary to existing signatures and is a prognostic tool for high risk ER-HER2- patients. We also demonstrate the potential clinical applicability of the BPMS as a single sample predictor. Together, these results reveal the potential of this pathway-based BPMS gene signature to identify high risk TNBC patients that can respond effectively to targeted therapy, and highlight BPMS genes as novel drug targets for therapeutic development.
Conflict of interest statement
Figures
Similar articles
-
Raf kinase inhibitory protein (RKIP) as a metastasis suppressor: regulation of signaling networks in cancer.Crit Rev Oncog. 2014;19(6):447-54. doi: 10.1615/critrevoncog.2014012000. Crit Rev Oncog. 2014. PMID: 25597354 Free PMC article. Review.
-
Network of mutually repressive metastasis regulators can promote cell heterogeneity and metastatic transitions.Proc Natl Acad Sci U S A. 2014 Jan 21;111(3):E364-73. doi: 10.1073/pnas.1304840111. Epub 2014 Jan 6. Proc Natl Acad Sci U S A. 2014. PMID: 24395801 Free PMC article.
-
Signalling pathway for RKIP and Let-7 regulates and predicts metastatic breast cancer.EMBO J. 2011 Aug 26;30(21):4500-14. doi: 10.1038/emboj.2011.312. EMBO J. 2011. PMID: 21873975 Free PMC article.
-
Integration of whole-genome sequencing and functional screening identifies a prognostic signature for lung metastasis in triple-negative breast cancer.Int J Cancer. 2019 Nov 15;145(10):2850-2860. doi: 10.1002/ijc.32329. Epub 2019 Apr 29. Int J Cancer. 2019. PMID: 30977117
-
BACH1, the master regulator gene: A novel candidate target for cancer therapy.Gene. 2016 Aug 15;588(1):30-7. doi: 10.1016/j.gene.2016.04.040. Epub 2016 Apr 22. Gene. 2016. PMID: 27108804 Review.
Cited by
-
Identification of KIF21B as a Biomarker for Colorectal Cancer and Associated with Poor Prognosis.J Oncol. 2022 Nov 21;2022:7905787. doi: 10.1155/2022/7905787. eCollection 2022. J Oncol. 2022. PMID: 36451772 Free PMC article.
-
MIRS: An AI scoring system for predicting the prognosis and therapy of breast cancer.iScience. 2023 Oct 26;26(11):108322. doi: 10.1016/j.isci.2023.108322. eCollection 2023 Nov 17. iScience. 2023. PMID: 38026206 Free PMC article.
-
Raf kinase inhibitory protein (RKIP) as a metastasis suppressor: regulation of signaling networks in cancer.Crit Rev Oncog. 2014;19(6):447-54. doi: 10.1615/critrevoncog.2014012000. Crit Rev Oncog. 2014. PMID: 25597354 Free PMC article. Review.
-
A Heme-Binding Transcription Factor BACH1 Regulates Lactate Catabolism Suggesting a Combined Therapy for Triple-Negative Breast Cancer.Cells. 2022 Mar 31;11(7):1177. doi: 10.3390/cells11071177. Cells. 2022. PMID: 35406740 Free PMC article.
-
Prognostic model development for classification of colorectal adenocarcinoma by using machine learning model based on feature selection technique boruta.Sci Rep. 2023 Apr 19;13(1):6413. doi: 10.1038/s41598-023-33327-4. Sci Rep. 2023. PMID: 37076536 Free PMC article.
References
-
- Perou CM, Sorlie T, Eisen MB, van de Rijn M, Jeffrey SS, et al. (2000) Molecular portraits of human breast tumours. Nature 406: 747–752. - PubMed
-
- Paik S, Shak S, Tang G, Kim C, Baker J, et al. (2004) A multigene assay to predict recurrence of tamoxifen-treated, node-negative breast cancer. N Engl J Med 351: 2817–2826. - PubMed
Publication types
MeSH terms
Substances
Grants and funding
LinkOut - more resources
Full Text Sources
Other Literature Sources
Molecular Biology Databases
Research Materials
Miscellaneous
