. 2013 Dec 9;8(12):e82173.
doi: 10.1371/journal.pone.0082173. eCollection 2013.

The microenvironment-specific transformation of adult stem cells models malignant triton tumors

Affiliations

The microenvironment-specific transformation of adult stem cells models malignant triton tumors

Mitra Lavasani et al. PLoS One. .

Abstract

Here, we demonstrated the differentiation potential of murine muscle-derived stem/progenitor cells (MDSPCs) toward myogenic, neuronal, and glial lineages. MDSPCs, following transplantation into a critical-sized sciatic nerve defect in mice, showed full regeneration with complete functional recovery of the injured peripheral nerve at 6 weeks post-implantation. However, several weeks after regeneration of the sciatic nerve, neoplastic growths were observed. The resulting tumors were malignant peripheral nerve sheath tumors (MPNSTs) with rhabdomyoblastic differentiation, expressing myogenic, neurogenic, and glial markers, common markers of human malignant triton tumors (MTTs). No signs of tumorigenesis were observed 17 weeks post-implantation of MDSPCs into the gastrocnemius muscles of dystrophic/mdx mice, or 1 year following subcutaneous or intravenous injection. While MDSPCs were not oncogenic in nature, the neoplasias were composed almost entirely of donor cells. Furthermore, cells isolated from the tumors were serially transplantable, generating tumors when reimplanted into mice. However, this transformation could be abrogated by differentiation of the cells toward the neurogenic lineage prior to implantation. These results establish that MDSPCs participated in the regeneration of the injured peripheral nerve but transformed in a microenvironment- and time-dependent manner, when they likely received concomitant neurogenic and myogenic differentiation signals. This microenvironment-specific transformation provides a useful mouse model for human MTTs and potentially some insight into the origins of this disease.


Conflict of interest statement

Competing Interests: Johnny Huard is a PLOS ONE Editorial Board member and this does not alter the authors' adherence to all the PLOS ONE policies on sharing data and materials.

Figures

Figure 1
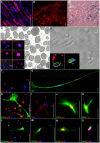
Figure 1. MDSPCs exhibit myogenic, neurogenic, and glial differentiation.
(A) Ten days after culture in low serum differentiation medium, MDSPCs differentiated into multinucleated myotubes expressing f-MyHC (red) (overlaid on nuclear counterstain [DAPI; blue]). (B) Many regenerated dystrophin-positive myofibers (red) are observed in gastrocnemius muscle cryosections of mdx mice (n  =  10) 14 days after injection. (C) The nLacZ-positive donor-derived MDSPCs (blue) could be detected in regenerated myofibers 17 weeks after injections. (D) MDSPCs were able to generate neurospheres (three-dimensional non-adherent clusters of cells) in enriched-culture medium within 7 to 10 days in culture (brightfield image). MDSPC-derived neurospheres express the neuronal cell markers β-tubulin III, NF, Neu-N, the myelin producing oligodendrocytes marker CNPase, the astrocytic marker GFAP, and retained their nestin (a neuroepithelial progenitor marker) expression (inset). Antibodies used are visualized in red with the nuclear stain, DAPI seen in blue. (E) The MDSPC-derived neurospheres can be further differentiated into neurons (β-tubulin [red], n), oligodendrocytes (NG2 [green], o), and astrocytes (GFAP [green], a) (inset). MDSPC-derived neurospheres expressed (F) nestin and were differentiated further into cells that expressed markers found on neuronal and glial (including oligodendrocytes, astrocytes, and Schwann cells) cells, including (G) NF, (H) S100, (I) O4, (J) OSP, (K) MBP, (L) CNPase, (M) GFAP, (N) the neurotrophin receptor p75, and (O) the tyrosine kinase receptor TrkA (all green, except O4 [red]). The nuclear stain DAPI seen in blue and β-gal-positive nuclei in red (for H and J-O). Data represent four to six independent experiments. Scale bars represent 100 µm (A-D) or 50 µm (E-O).
Figure 2
Figure 2. Transplanted MDSPCs foster repair of critical-size sciatic nerve defects.
(A) A 4- to 5 mm segment of the sciatic nerve was removed from the hind limb of each mouse, (B) resulting in a 6.5 to 7 mm defect. (C) Following transplantation of MDSPCs into the defect, complete regeneration from proximal to distal end was observed (n  =  28). Blood vessel networks (arrowheads) were also present around all regenerated nerves. (D) Many nLacZ-positive cells (blue) were observed between weeks 5 and 9 following injury. “p” corresponds to the proximal stump and “d” to the distal stump. (E) The regenerated nerve exhibited both NF (green) and CNPase (red) immunoreactivity. (F) CNPase (red) staining of the regenerated sciatic nerve revealed nodes of Ranvier-like structures (white circles). (G) Cross-sections of regenerated nerve showed nLacZ-positive cells (blue) and exhibited NF-positive axons (green, inset) encompassed by FluoroMyelin-positive cells (red, inset). (H, I, J) Colocalization of β-gal (red) with (H, I) GFAP (green) or (J) CNPase (green), and DAPI (blue) suggests possible differentiation of the MDSPCs into Schwann cells (double-positive cells denoted by arrows). (K-M) Electron microscopy of semi-thin cross-sections of (K) non-operated (uninjured) control, and (L, M) MDSPC-regenerated peripheral nerve 10 weeks after implantation, show a high number of myelin-producing Schwann cells. Arrows indicate Schwann cells surrounding the myelinated axon. “Sc” corresponds to Schwann cells, “M” to myelin sheath, and “Ax” to axons. (N) Graphical quantification of the g-ratio (axonal area: myelinated fiber area) represents the median values of both uninjured and MDSPC-regenerated nerves (P<0.001, Mann-Whitney Rank Sum Test). Sciatic nerve regeneration studies represent three independent experiments. The morphometric parameters represent results from 5 mice (2 controls and 3 treated) and analysis of 1000 fibers. Scale bars represent 100 µm (D, E, and G) or 10 µm (F, H-M).
Figure 3
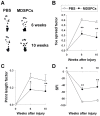
Figure 3. Transplanted MDSPCs assist in functional recovery of critically-sized sciatic nerve defects.
(A) A depiction of representative paw prints from control- and MDSPC-implanted mice at 6 and 10 weeks post-implantation. (B-D) Quantification of paw print analyses, indicating that MDSPC transplantation increases the ability of the mice to walk normally, displayed a (B) decrease in toe spread factor, (C) decrease in print length factor, and (D) an increase in SFI (sciatic functional index) compared to PBS-treated mice. Thirty-five paw prints were analyzed per group for each time point. Error bars indicate s.e.m. (*P<0.05 and **P<0.001, Mann-Whitney Rank Sum Test).
Figure 4
Figure 4. Between weeks 11 and 13, approximately 70% of the mice (n  =  28) implanted with MDSPCs formed large neoplastic growths.
(A, B) Representative image of hematoxylin and eosin staining of tumors that formed in mice implanted with MDSPCs. (C-L) The resulting tumors were classified as malignant peripheral nerve sheath tumors with rhabdomyoblastic differentiation (Triton tumors) by showing positivity for (C, D) smooth muscle actin (brown), (E, F) desmin (brown), (G, H) NF (brown), and pockets of (I, J) S100 (brown), (K, L) as well as cells positive for both NF (brown) and S100 (purple). Positive cells (brown, C-J) or double-positive cells (K and L) are indicated by black arrows. Images B, D, F, H, J, and L show a higher magnification image of the image they were preceded by. (M, N) The neoplasias were also positive for FluoroMyelin (green), showing areas of unorganized myelin deposition. (O) Image depicting NF (green) and FluoroMyelin (red) double-stained sections from a regenerated nerve (white arrow) in the area of tumorigenesis. Negative control sections were similarly processed without primary antibodies. Scale bars represent 100 µm.
Figure 5
Figure 5. TDCs maintain their neurogenic and myogenic differentiation potential in vitro.
(A) TDCs grew as neurosphere-like structures in the absence of neurogenic medium, and (B) were nLacZ-positive (blue). (C-H) Immunofluorescent analysis of these spontaneously-occurring neurosphere-like structures demonstrated that they were positive for (C) β-tubulin III, (D) CNPase, (E) GFAP, (F) nestin, and (G) NF, but were negative for (H) Neu-N. For all immunofluorescence, the antibodies used are visualized in red, with the nuclear stain DAPI seen in blue. (I-L) Cell cycle analysis of the parental MDSPCs and TDCs was performed by FACS. Shown is the (I, J) DNA content and (K, L) graphical representation of the results, indicating the apoptotic, G0/G1, S, and G2/M fractions. (M, N) Karyotypic analysis of MDSPCs and TDCs. (M) Depicted is a representative karyotype from the MDSPC population (40, XX). (N) Karyotype of one of the TDCs that has 68 chromosomes, is hypertriploid, and expresses several unidentifiable marker chromosomes, the largest of which appears to be dicentric. Scale bars represent 100 µm.
Figure 6
Figure 6. TDCs can regenerate tumors in vivo.
(A, B) Hematoxylin and eosin staining of a tumor generated from TDCs implanted into a sciatic nerve defect in mice (n  =  16) demonstrates the destruction of the bone, as seen by the smooth and pink stained portion (arrows). (C, D) In vitro myogenic analysis demonstrates that the TDCs possess expression of (C) the myogenic marker desmin (red, 12%) and have the ability to form myotubes in vitro, as seen by (D) f-MyHC staining (red). (E, F) In vivo myogenic analysis demonstrates that although (E) parental MDSPCs (blue) showed myofiber regeneration (muscles stained with eosin) after injection into the gastrocnemius muscles of mdx mice and were detected up to 17 weeks without sign of tumor formation (n  =  10), the (F) TDCs (blue) implanted into the muscle formed tumor 100% of the time (n  =  10), and as early as 4 weeks post-implantation. (G) A schematic of the experimental design and results displayed above. Negative control sections were similarly processed without primary antibodies. Scale bars represent 250 µm (A) or 100 µm (B-F).
Figure 7
Figure 7. Differentiation of MDSPCs to a neurogenic lineage prior to implantation decreases their ability to respond to environmental cues and stops transformation.
(A-C) Two weeks post-implantation MDSPC-derived neurospheres showed a reduction in muscle regeneration when compared to the parental MDSPCs. (A) The nLacZ donor-derived MDSPC-derived neurospheres (blue) could be detected in eosin stained regenerated myofibers and (B) showed fewer regenerated dystrophin-positive myofibers (red) compared to undifferentiated MDSPCs. (C) Graphical representation of the regeneration index (number of dystrophin positive fibers/100,000 injected cells) of parental MDSPCs and MDSPC-derived neurospheres (NS). NS-injected mice yield a lower regeneration index compared to the undifferentiated MDSPCs. Error bars indicate ± s.d. (**P<0.001, Mann-Whitney Rank Sum Test). (D-F) When dissociated MDSPC-derived neurospheres were implanted into a sciatic nerve defect, tumor formation was abrogated. Furthermore, 80% of mice (n  =  5) formed large fibrotic masses, as seen by (D) eosin staining with nLacZ donor MDSPC-derived neurospheres shown in blue, in addition to (E) intense collagen deposits identified with Masson’s Trichrome staining (blue). (F) Graphical representation of the Trichrome-positive area of parental MDSPCs and NS. Parental MDSPCs show minimal signs of fibrosis evident by a lower percentage of collagen-positive area. Error bars indicate ± s.d. (**P<0.001, Mann-Whitney Rank Sum Test). (G) A schematic of the experimental design and results. Scale bars represent 10 µm.

Similar articles

Cited by

References

    1. Powell K (2005) Stem-cell niches: it's the ecology, stupid! Nature. 435: 268–270. - PubMed
    1. Blau HM, Brazelton TR, Weimann JM (2001) The evolving concept of a stem cell: entity or function? Cell 105: 829–841. - PubMed
    1. Rizo A, Vellenga E, de Haan G, Schuringa JJ (2006) Signaling pathways in self-renewing hematopoietic and leukemic stem cells: do all stem cells need a niche? Hum Mol Genet 15 Spec No 2: R210–219. - PubMed
    1. Doetsch F (2003) A niche for adult neural stem cells. Curr Opin Genet Dev 13: 543–550. - PubMed
    1. Cao Q, Benton RL, Whittemore SR (2002) Stem cell repair of central nervous system injury. J Neurosci Res 68: 501–510. - PubMed

Publication types

MeSH terms

LinkOut - more resources