

Syndromic surveillance using veterinary laboratory data: algorithm combination and customization of alerts
- PMID: 24349216
- PMCID: PMC3859592
- DOI: 10.1371/journal.pone.0082183
Syndromic surveillance using veterinary laboratory data: algorithm combination and customization of alerts
Abstract
Background: Syndromic surveillance research has focused on two main themes: the search for data sources that can provide early disease detection; and the development of efficient algorithms that can detect potential outbreak signals.
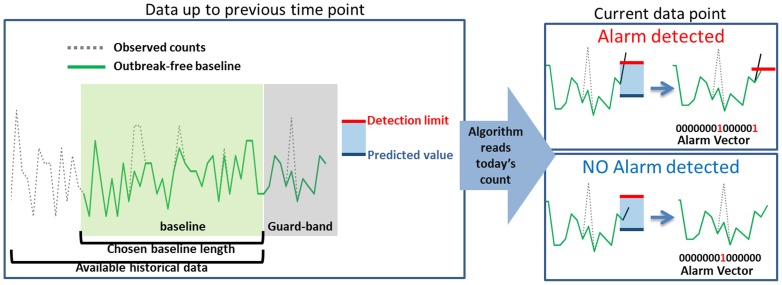
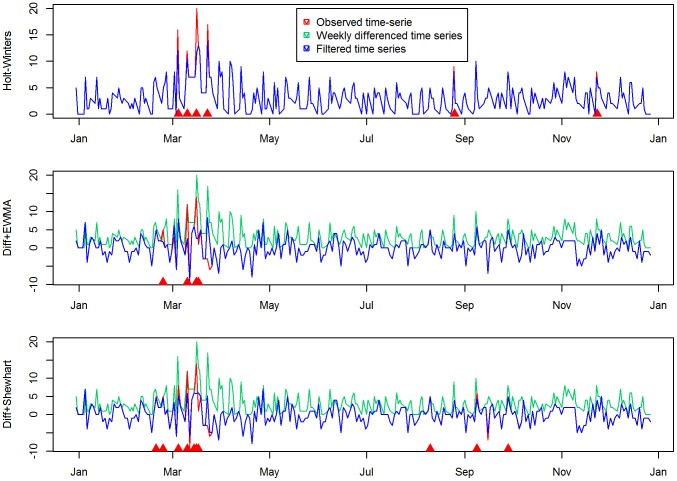
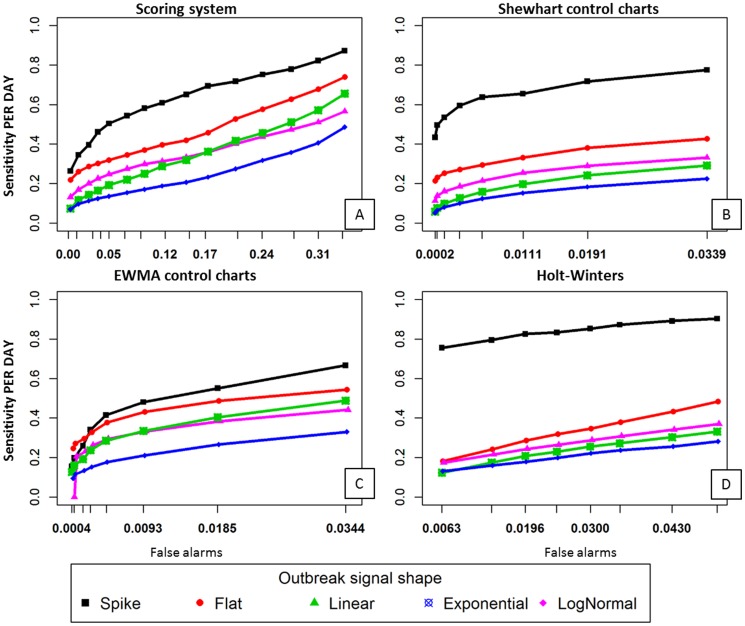
Methods: This work combines three algorithms that have demonstrated solid performance in detecting simulated outbreak signals of varying shapes in time series of laboratory submissions counts. These are: the Shewhart control charts designed to detect sudden spikes in counts; the EWMA control charts developed to detect slow increasing outbreaks; and the Holt-Winters exponential smoothing, which can explicitly account for temporal effects in the data stream monitored. A scoring system to detect and report alarms using these algorithms in a complementary way is proposed.
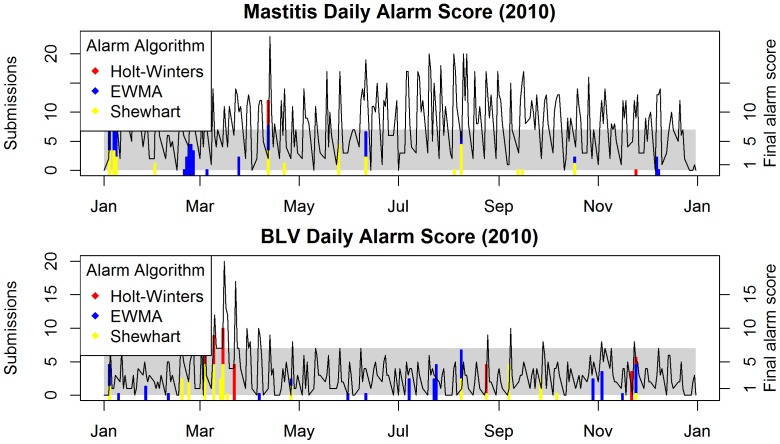
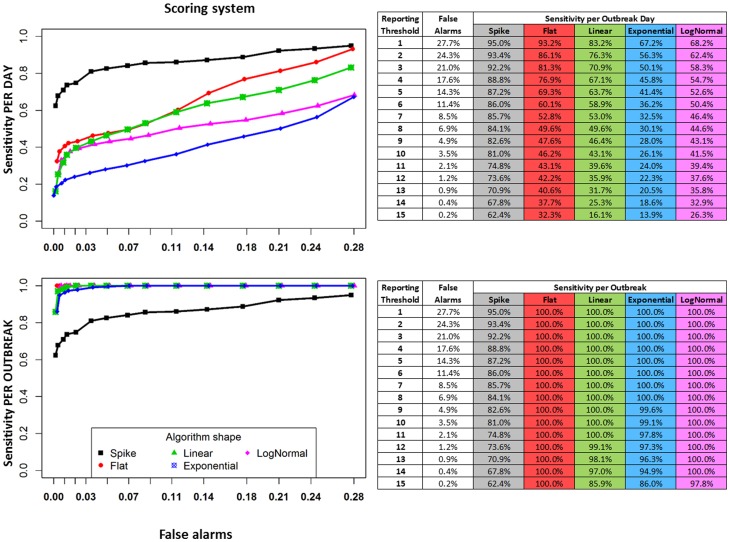
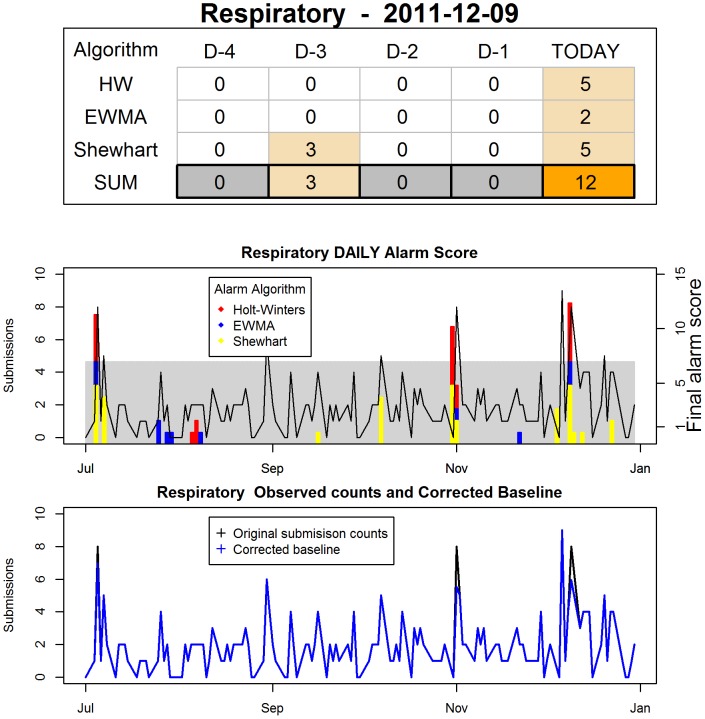
Results: The use of multiple algorithms in parallel resulted in increased system sensitivity. Specificity was decreased in simulated data, but the number of false alarms per year when the approach was applied to real data was considered manageable (between 1 and 3 per year for each of ten syndromic groups monitored). The automated implementation of this approach, including a method for on-line filtering of potential outbreak signals is described.
Conclusion: The developed system provides high sensitivity for detection of potential outbreak signals while also providing robustness and flexibility in establishing what signals constitute an alarm. This flexibility allows an analyst to customize the system for different syndromes.
Conflict of interest statement
Figures
Similar articles
-
Syndromic surveillance using veterinary laboratory data: data pre-processing and algorithm performance evaluation.J R Soc Interface. 2013 Apr 10;10(83):20130114. doi: 10.1098/rsif.2013.0114. Print 2013 Jun 6. J R Soc Interface. 2013. PMID: 23576782 Free PMC article.
-
Methodological challenges to multivariate syndromic surveillance: a case study using Swiss animal health data.BMC Vet Res. 2016 Dec 20;12(1):288. doi: 10.1186/s12917-016-0914-2. BMC Vet Res. 2016. PMID: 27998276 Free PMC article.
-
Pilot simulation study using meat inspection data for syndromic surveillance: use of whole carcass condemnation of adult cattle to assess the performance of several algorithms for outbreak detection.Epidemiol Infect. 2015 Sep;143(12):2559-69. doi: 10.1017/S0950268814003495. Epub 2015 Jan 8. Epidemiol Infect. 2015. PMID: 25566974 Free PMC article.
-
Cluster Detection Mechanisms for Syndromic Surveillance Systems: Systematic Review and Framework Development.JMIR Public Health Surveill. 2020 May 26;6(2):e11512. doi: 10.2196/11512. JMIR Public Health Surveill. 2020. PMID: 32357126 Free PMC article.
-
Outbreak detection through automated surveillance: a review of the determinants of detection.J Biomed Inform. 2007 Aug;40(4):370-9. doi: 10.1016/j.jbi.2006.09.003. Epub 2006 Oct 5. J Biomed Inform. 2007. PMID: 17095301 Review.
Cited by
-
Animal health syndromic surveillance: a systematic literature review of the progress in the last 5 years (2011-2016).Vet Med (Auckl). 2016 Nov 15;7:157-170. doi: 10.2147/VMRR.S90182. eCollection 2016. Vet Med (Auckl). 2016. PMID: 30050848 Free PMC article. Review.
-
Veterinary syndromic surveillance in practice: costs and benefits for governmental organizations.Infect Ecol Epidemiol. 2015 Dec 2;5:29973. doi: 10.3402/iee.v5.29973. eCollection 2015. Infect Ecol Epidemiol. 2015. PMID: 26634845 Free PMC article.
-
Improving the Utility of Voluntary Ovine Fallen Stock Collection and Laboratory Diagnostic Submission Data for Animal Health Surveillance Purposes: A Development Cycle.Front Vet Sci. 2020 Jan 24;6:487. doi: 10.3389/fvets.2019.00487. eCollection 2019. Front Vet Sci. 2020. PMID: 32039248 Free PMC article.
-
Evaluation of the application of sequence data to the identification of outbreaks of disease using anomaly detection methods.Vet Res. 2023 Sep 8;54(1):75. doi: 10.1186/s13567-023-01197-3. Vet Res. 2023. PMID: 37684632 Free PMC article.
-
Influenza detection and prediction algorithms: comparative accuracy trial in Östergötland county, Sweden, 2008-2012.Epidemiol Infect. 2017 Jul;145(10):2166-2175. doi: 10.1017/S0950268817001005. Epub 2017 May 17. Epidemiol Infect. 2017. PMID: 28511741 Free PMC article.
References
-
- Bravata DM, McDonald KM, Smith WM, Rydzak C, Szeto H, et al. (2004) Systematic review: surveillance systems for early detection of bioterrorism-related diseases. Annals of Internal Medicine 140 (11): 910–922. - PubMed
-
- Centers for Disease Control and Prevention (CDC). Annotated bibliography for syndromic surveillance. Available: http://www.cdc.gov/ncphi/disss/nndss/syndromic.htm. Accessed 17 Jun 2010.
-
- Buckeridge DL, Burkom H, Campbell M, Hogan WR, Moore A (2005) WAlgorithms for rapid outbreak detection: a research synthesis. Journal of Biomedical Informatics 38 (2): 99–113. - PubMed
-
- Lotze T, Murphy S, Shmueli G (2008) Implementation and comparison of preprocessing methods for biosurveillance data. Advances in Disease Surveillance 6 (1): 1–20.
-
- Buckeridge DL, Switzer P, Owens D, Siegrist D, Pavlin J, et al. (2005) An evaluation model for syndromic surveillance: assessing the performance of a temporal algorithm. Morbidity and Mortality Weekly Report 54 Suppl109–115. - PubMed
Publication types
MeSH terms
LinkOut - more resources
Full Text Sources
Other Literature Sources
Medical
