Resistance to ROS1 inhibition mediated by EGFR pathway activation in non-small cell lung cancer
- PMID: 24349229
- PMCID: PMC3862576
- DOI: 10.1371/journal.pone.0082236
Resistance to ROS1 inhibition mediated by EGFR pathway activation in non-small cell lung cancer
Abstract
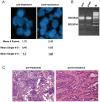
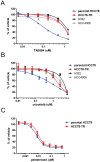
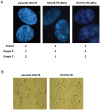
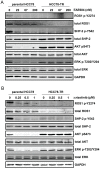
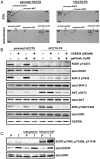
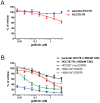
The targeting of oncogenic 'driver' kinases with small molecule inhibitors has proven to be a highly effective therapeutic strategy in selected non-small cell lung cancer (NSCLC) patients. However, acquired resistance to targeted therapies invariably arises and is a major limitation to patient care. ROS1 fusion proteins are a recently described class of oncogenic driver, and NSCLC patients that express these fusions generally respond well to ROS1-targeted therapy. In this study, we sought to determine mechanisms of acquired resistance to ROS1 inhibition. To accomplish this, we analyzed tumor samples from a patient who initially responded to the ROS1 inhibitor crizotinib but eventually developed acquired resistance. In addition, we generated a ROS1 inhibition-resistant derivative of the initially sensitive NSCLC cell line HCC78. Previously described mechanisms of acquired resistance to tyrosine kinase inhibitors including target kinase-domain mutation, target copy number gain, epithelial-mesenchymal transition, and conversion to small cell lung cancer histology were found to not underlie resistance in the patient sample or resistant cell line. However, we did observe a switch in the control of growth and survival signaling pathways from ROS1 to EGFR in the resistant cell line. As a result of this switch, ROS1 inhibition-resistant HCC78 cells became sensitive to EGFR inhibition, an effect that was enhanced by co-treatment with a ROS1 inhibitor. Our results suggest that co-inhibition of ROS1 and EGFR may be an effective strategy to combat resistance to targeted therapy in some ROS1 fusion-positive NSCLC patients.
Conflict of interest statement
Figures

Similar articles
-
Combined effect of cabozantinib and gefitinib in crizotinib-resistant lung tumors harboring ROS1 fusions.Cancer Sci. 2018 Oct;109(10):3149-3158. doi: 10.1111/cas.13752. Epub 2018 Sep 11. Cancer Sci. 2018. PMID: 30053332 Free PMC article.
-
An Activating KIT Mutation Induces Crizotinib Resistance in ROS1-Positive Lung Cancer.J Thorac Oncol. 2016 Aug;11(8):1273-1281. doi: 10.1016/j.jtho.2016.04.001. Epub 2016 Apr 9. J Thorac Oncol. 2016. PMID: 27068398 Free PMC article.
-
Molecular Changes Associated with Acquired Resistance to Crizotinib in ROS1-Rearranged Non-Small Cell Lung Cancer.Clin Cancer Res. 2015 May 15;21(10):2379-87. doi: 10.1158/1078-0432.CCR-14-1350. Epub 2015 Feb 16. Clin Cancer Res. 2015. PMID: 25688157
-
Targeted therapies in non-small cell lung cancer: a focus on ALK/ROS1 tyrosine kinase inhibitors.Expert Rev Anticancer Ther. 2018 Jan;18(1):71-80. doi: 10.1080/14737140.2018.1412260. Epub 2017 Dec 6. Expert Rev Anticancer Ther. 2018. PMID: 29187012 Review.
-
ROS1 protein-tyrosine kinase inhibitors in the treatment of ROS1 fusion protein-driven non-small cell lung cancers.Pharmacol Res. 2017 Jul;121:202-212. doi: 10.1016/j.phrs.2017.04.022. Epub 2017 Apr 30. Pharmacol Res. 2017. PMID: 28465216 Review.
Cited by
-
ROS1-dependent cancers - biology, diagnostics and therapeutics.Nat Rev Clin Oncol. 2021 Jan;18(1):35-55. doi: 10.1038/s41571-020-0408-9. Epub 2020 Aug 5. Nat Rev Clin Oncol. 2021. PMID: 32760015 Free PMC article. Review.
-
Molecularly targeted therapies in non-small-cell lung cancer annual update 2014.J Thorac Oncol. 2015 Jan;10(1 Suppl 1):S1-63. doi: 10.1097/JTO.0000000000000405. J Thorac Oncol. 2015. PMID: 25535693 Free PMC article.
-
Small cell transformation of ROS1 fusion-positive lung cancer resistant to ROS1 inhibition.NPJ Precis Oncol. 2020 Aug 3;4:21. doi: 10.1038/s41698-020-0127-9. eCollection 2020. NPJ Precis Oncol. 2020. PMID: 32802958 Free PMC article.
-
Personalized therapy for lung cancer: striking a moving target.JCI Insight. 2018 Aug 9;3(15):e120858. doi: 10.1172/jci.insight.120858. eCollection 2018 Aug 9. JCI Insight. 2018. PMID: 30089719 Free PMC article. Review.
-
ADK-VR2, a cell line derived from a treatment-naïve patient with SDC4-ROS1 fusion-positive primarily crizotinib-resistant NSCLC: a novel preclinical model for new drug development of ROS1-rearranged NSCLC.Transl Lung Cancer Res. 2022 Nov;11(11):2216-2229. doi: 10.21037/tlcr-22-163. Transl Lung Cancer Res. 2022. PMID: 36519016 Free PMC article.
References
-
- Jemal A, Bray F (2011) Center MM, Ferlay J, Ward E, et al (2011) Global cancer statistics. CA Cancer J Clin 61: 69–90. - PubMed
-
- Lynch TJ, Bell DW, Sordella R, Gurubhagavatula S, Okimoto RA, et al. (2004) Activating mutations in the epidermal growth factor receptor underlying responsiveness of non-small-cell lung cancer to gefitinib. N Engl J Med 350: 2129–2139. - PubMed
Publication types
MeSH terms
Substances
Grants and funding
LinkOut - more resources
Full Text Sources
Other Literature Sources
Medical
Research Materials
Miscellaneous

