

Procalcitonin levels predict acute kidney injury and prognosis in acute pancreatitis: a prospective study
- PMID: 24349237
- PMCID: PMC3862675
- DOI: 10.1371/journal.pone.0082250
Procalcitonin levels predict acute kidney injury and prognosis in acute pancreatitis: a prospective study
Abstract
Background: Acute kidney injury (AKI) has been proposed as a leading cause of mortality for acute pancreatitis (AP) patients admitted to the intensive care unit (ICU). This study investigated the predictive value of procalcitonin (PCT) for AKI development and relevant prognosis in patients with AP, and compared PCT's predictive power with that of other inflammation-related variables.
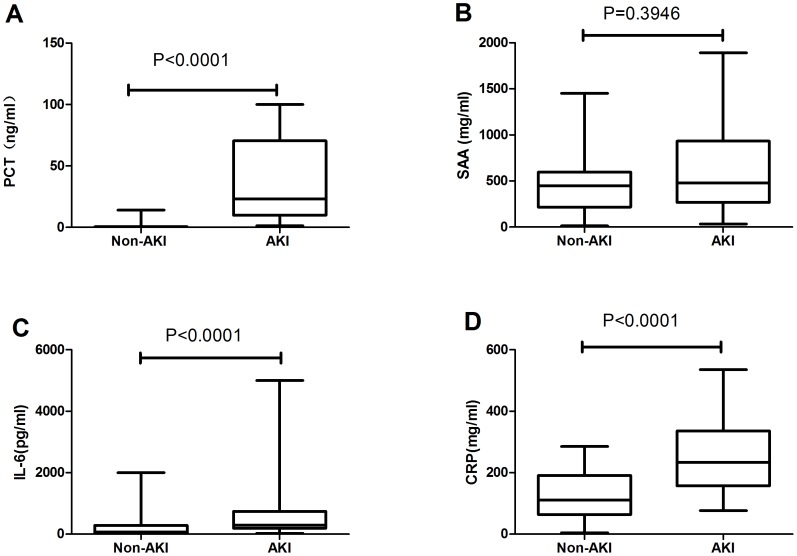
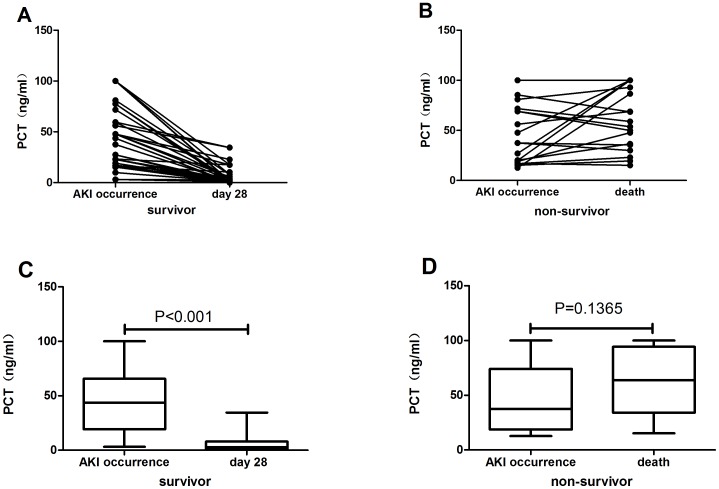
Methods: Between January 2011 and March 2013, we enrolled 305 cases with acute pancreatitis admitted to ICU. Serum levels of PCT, serum amyloid A (SAA), interleukin-6 (IL-6), and C reactive protein (CRP) were determined on admission. Serum PCT was tested in patients who developed AKI on the day of AKI occurrence and on either day 28 after occurrence (for survivors) or on the day of death (for those who died within 28 days).
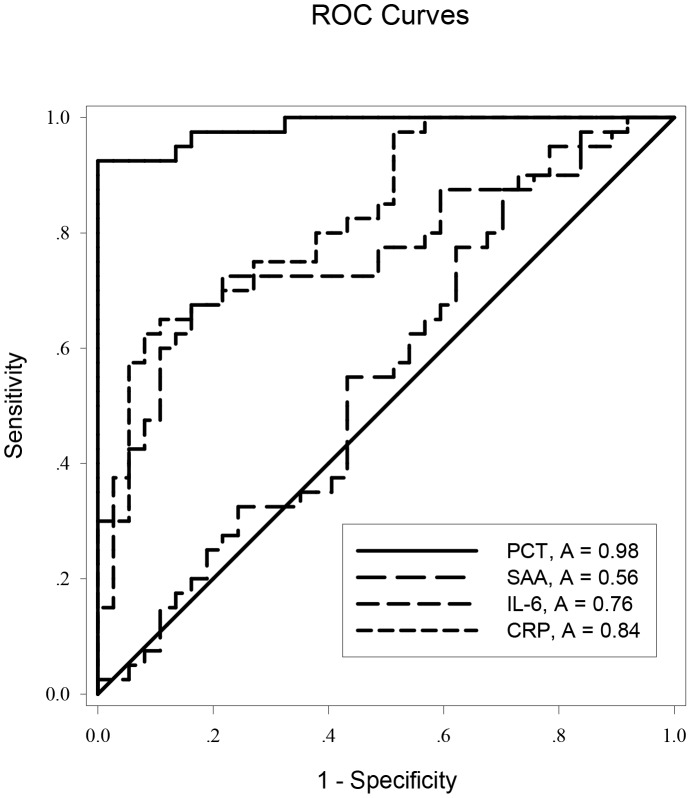
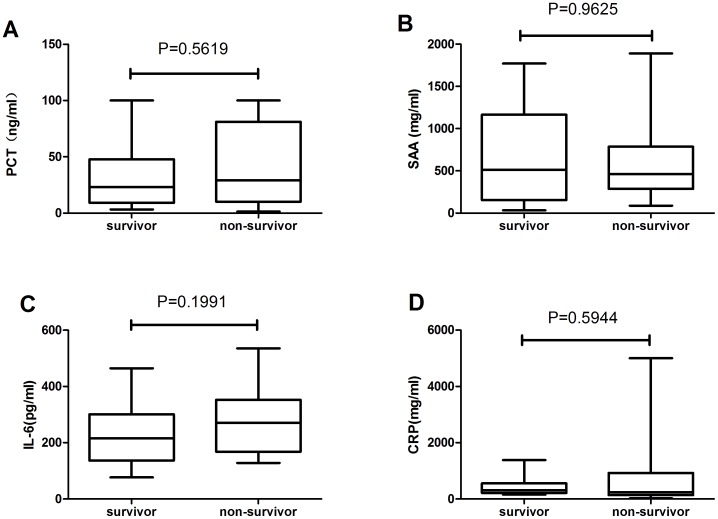
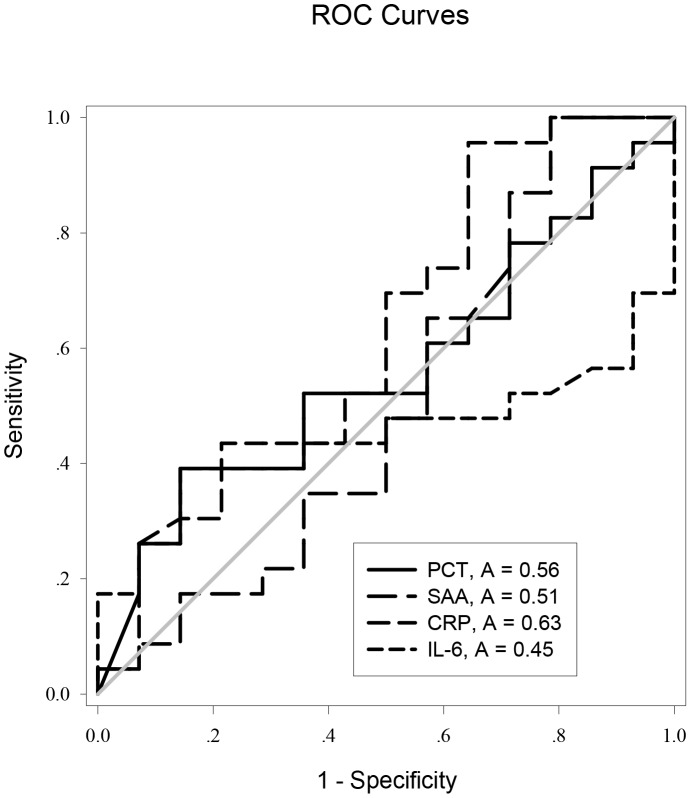
Results: Serum PCT levels were 100-fold higher in the AKI group than in the non-AKI group on the day of ICU admission (p<0.05). The area under the receiver-operating characteristic (ROC) curve of PCT for predicting AKI was 0.986, which was superior to SAA, CRP, and IL-6 (p<0.05). ROC analysis revealed all variables tested had lower predictive performance for AKI prognosis. The average serum PCT level on day 28 (2.67 (0.89, 7.99) ng/ml) was significantly (p<0.0001) lower than on the day of AKI occurrence (43.71 (19.24,65.69) ng/ml) in survivors, but the serum PCT level on death (63.73 (34.22,94.30) ng/ml) was higher than on the day of AKI occurrence (37.55 (18.70,74.12) ng/ml) in non-survivors, although there was no significant difference between the two days in the latter group (p = 0.1365).
Conclusion: Serum PCT is superior to CRP, IL-6, and SAA for predicting the development of AKI in patients with AP, and also can be used for dynamic evaluation of AKI prognosis.
Conflict of interest statement
Figures
References
-
- Li H, Qian Z, Liu Z, Liu X, Han X, et al. (2010) Risk factors and outcome of acute renal failure in patients with severe acute pancreatitis. J Crit Care 25: 225–229. - PubMed
-
- Coca SG, Yalavarthy R, Concato J, Parikh CR (2008) Biomarkers for the diagnosis and risk stratification of acute kidney injury: a systematic review. Kidney Int 73: 1008–1016. - PubMed
-
- Moya F, Nieto A, R-Candela JL (1975) Calcitonin biosynthesis: evidence for a precursor. Eur J Biochem 55: 407–413. - PubMed
-
- Morgenthaler NG, Struck J, Fischer-Schulz C, Seidel-Mueller E, Beier W, et al. (2002) Detection of procalcitonin (PCT) in healthy controls and patients with local infection by a sensitive ILMA. Clin Lab 48: 263–270. - PubMed
Publication types
MeSH terms
Substances
LinkOut - more resources
Full Text Sources
Other Literature Sources
Medical
Research Materials
Miscellaneous
