

Resistance to bleomycin in cancer cell lines is characterized by prolonged doubling time, reduced DNA damage and evasion of G2/M arrest and apoptosis
- PMID: 24349265
- PMCID: PMC3857806
- DOI: 10.1371/journal.pone.0082363
Resistance to bleomycin in cancer cell lines is characterized by prolonged doubling time, reduced DNA damage and evasion of G2/M arrest and apoptosis
Abstract
Background: To establish, characterize and elucidate potential mechanisms of acquired bleomycin (BLM) resistance using human cancer cell lines. Seven BLM-resistant cell lines were established by exposure to escalating BLM concentrations over a period of 16-24 months. IC50 values and cell doubling times were quantified using a real time cytotoxicity assay. COMET and γ-H2AX assays, cell cycle analysis, and apoptosis assessment further investigated the mechanisms of BLM resistance in these cell lines.
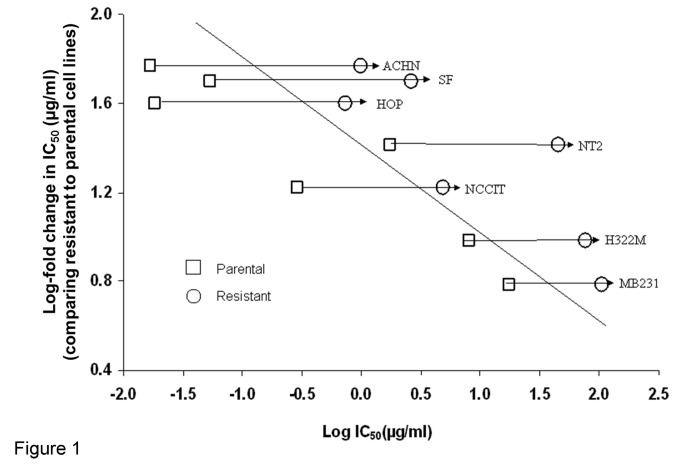
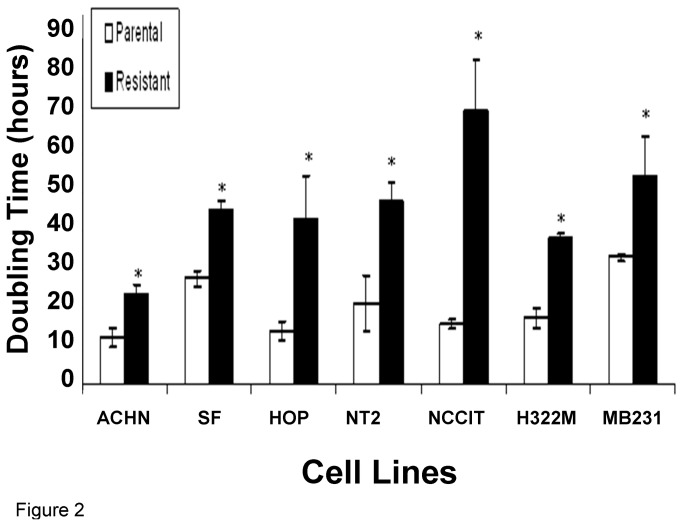
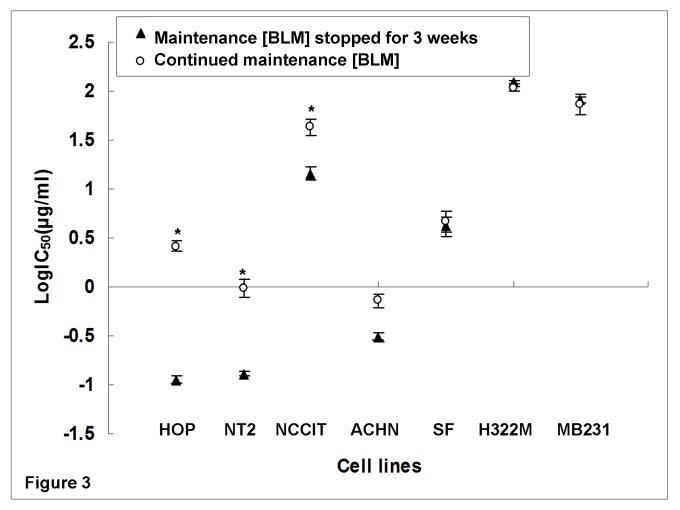
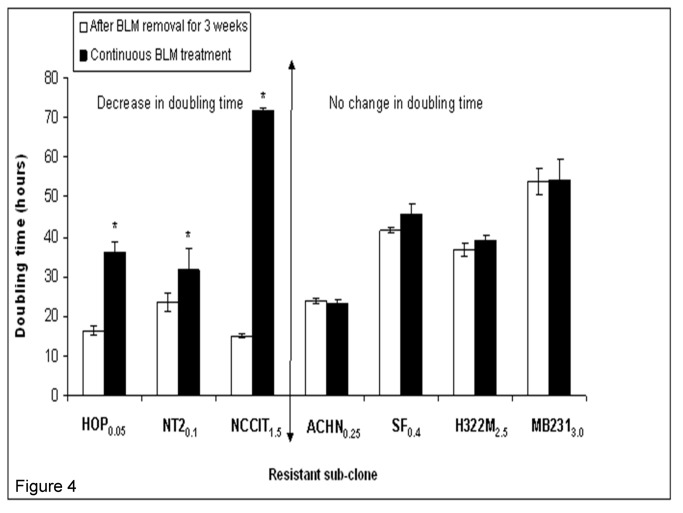
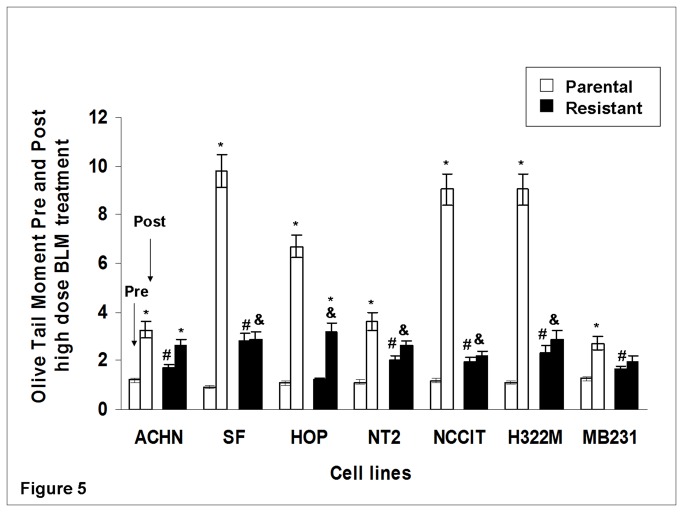
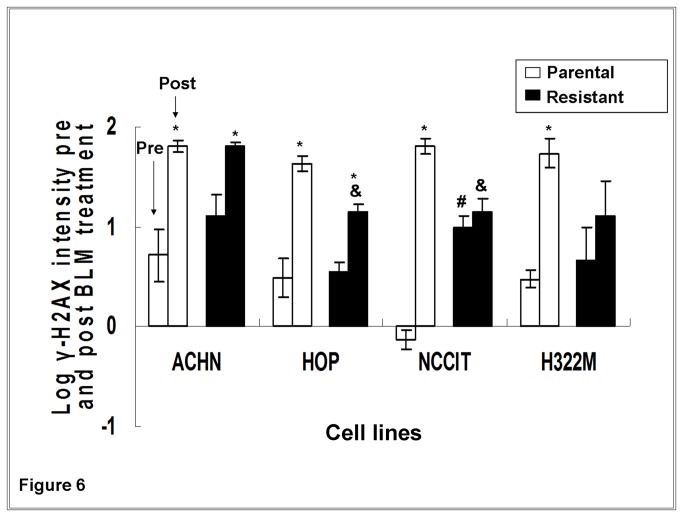
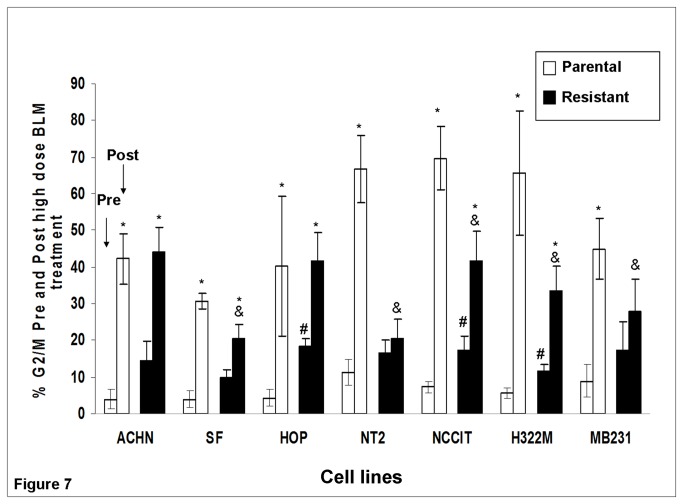
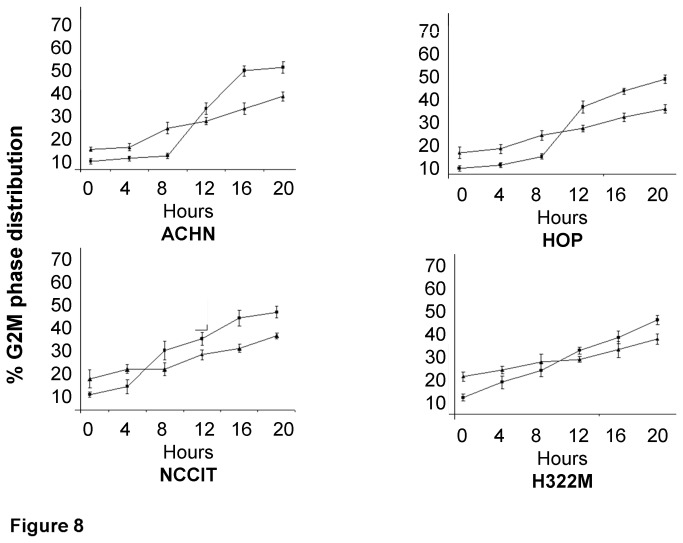
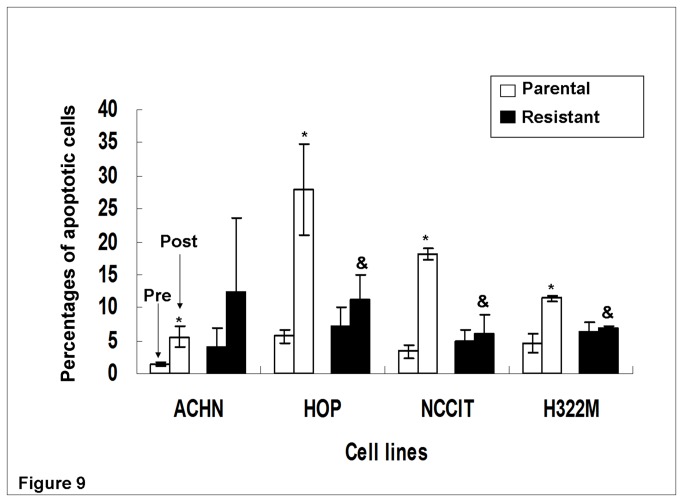
Results: Compared with parental cell lines, real time cytotoxicity assays revealed 7 to 49 fold increases in IC50 and a mean doubling time increase of 147 % (range 64 %-352%) in BLM-resistant sub-clones (p<0.05 for both). Higher maintenance BLM concentrations were associated with higher IC50 and increased doubling times (p<0.05). Significantly reduced DNA damage (COMET and γ-H2AX assays), G2/M arrest, and apoptosis (p<0.05 for each set of comparison) following high-dose acute BLM exposure was observed in resistant sub-clones, compared with their BLM-sensitive parental counterparts. Three weeks of BLM-free culturing resulted in a partial return to BLM sensitivity in 3/7 BLM-resistant sub-clones (p<0.05).
Conclusion: Bleomycin resistance may be associated with reduced DNA damage after bleomycin exposure, resulting in reduced G2/M arrest, and reduced apoptosis.
Conflict of interest statement
Figures
Similar articles
-
2α-Hydroxyalantolactone from Pulicaria undulata: activity against multidrug-resistant tumor cells and modes of action.Phytomedicine. 2021 Jan;81:153409. doi: 10.1016/j.phymed.2020.153409. Epub 2020 Nov 17. Phytomedicine. 2021. PMID: 33341310
-
TLC388 Induces DNA Damage and G2 Phase Cell Cycle Arrest in Human Non-Small Cell Lung Cancer Cells.Cancer Control. 2020 Jan-Dec;27(1):1073274819897975. doi: 10.1177/1073274819897975. Cancer Control. 2020. PMID: 32281394 Free PMC article.
-
Increased glutathione level is not involved in enhanced bleomycin sensitivity in cisplatin-resistant 2780CP cells.Anticancer Res. 2008 Sep-Oct;28(5A):2663-8. Anticancer Res. 2008. PMID: 19035292
-
Artemisinin induces selective and potent anticancer effects in drug resistant breast cancer cells by inducing cellular apoptosis and autophagy and G2/M cell cycle arrest.J BUON. 2020 May-Jun;25(3):1330-1336. J BUON. 2020. PMID: 32862573
-
Genetic toxicology of bleomycin.Mutat Res. 1978;55(2):121-45. doi: 10.1016/0165-1110(78)90019-2. Mutat Res. 1978. PMID: 86155 Review.
Cited by
-
Patterns of spontaneous and induced genomic alterations in Yarrowia lipolytica.Appl Environ Microbiol. 2025 Jan 31;91(1):e0167824. doi: 10.1128/aem.01678-24. Epub 2024 Dec 23. Appl Environ Microbiol. 2025. PMID: 39714191 Free PMC article.
-
Uncovering Bleomycin-Induced Genomic Alterations and Underlying Mechanisms in the Yeast Saccharomyces cerevisiae.Appl Environ Microbiol. 2022 Jan 25;88(2):e0170321. doi: 10.1128/AEM.01703-21. Epub 2021 Nov 3. Appl Environ Microbiol. 2022. PMID: 34731050 Free PMC article.
-
Biodiversity of endosymbiont fungi associated with a marine sponge Lamellodysidea herbacea and their potential as antioxidant producers.3 Biotech. 2024 May;14(5):146. doi: 10.1007/s13205-024-03972-1. Epub 2024 May 3. 3 Biotech. 2024. PMID: 38706926 Free PMC article.
-
Electrochemotherapy of radioresistant head and neck squamous cell carcinoma cells and tumor xenografts.Oncol Rep. 2019 Mar;41(3):1658-1668. doi: 10.3892/or.2019.6960. Epub 2019 Jan 9. Oncol Rep. 2019. PMID: 30628709 Free PMC article.
-
Pingyangmycin inhibits glycosaminoglycan sulphation in both cancer cells and tumour tissues.J Cell Mol Med. 2020 Mar;24(6):3419-3430. doi: 10.1111/jcmm.15017. Epub 2020 Feb 18. J Cell Mol Med. 2020. PMID: 32068946 Free PMC article.
References
-
- Umezawa H, Maeda K, Takeuchi T, Okami Y (1996) New anti-biotics, bleomycin A and B. J Antibiot 19: 200–209. - PubMed
Publication types
MeSH terms
Substances
LinkOut - more resources
Full Text Sources
Other Literature Sources
